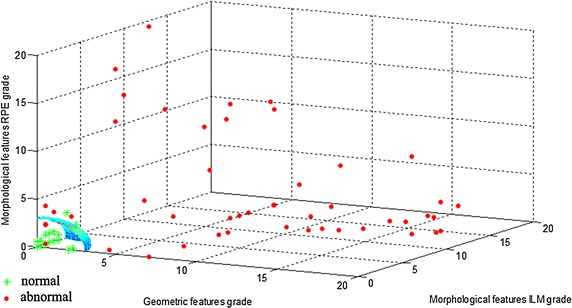
Fig. 13.

The scatter plot of testing images. The features in each image were grouped and converted into a three dimensional data point. The normal and abnormal images labeled by ophthalmologist were marked for different scatter points. The testing images were judged normal or abnormal based on the 1/8 spherical surface in our algorithm. The points in the inner space of spherical surface were judged normal and the points in the outer space were judged abnormal. It can be seen from the image that the abnormal judgment method presented in this paper is basically consistent with the results of ophthalmologists
