Fig. 7.

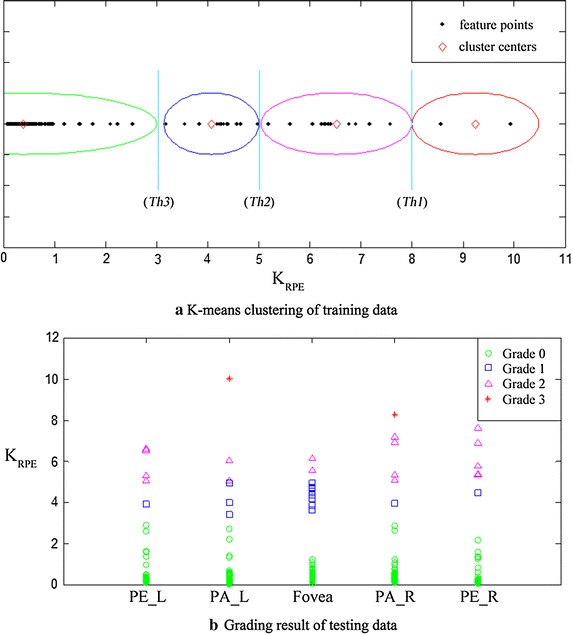
Diagrams of feature data processing. a The feature values from 50 training images. These feature values were divided into four groups and three thresholds were acquired. b The grading results of testing data by the acquired thresholds

Diagrams of feature data processing. a The feature values from 50 training images. These feature values were divided into four groups and three thresholds were acquired. b The grading results of testing data by the acquired thresholds