Fig. 3.

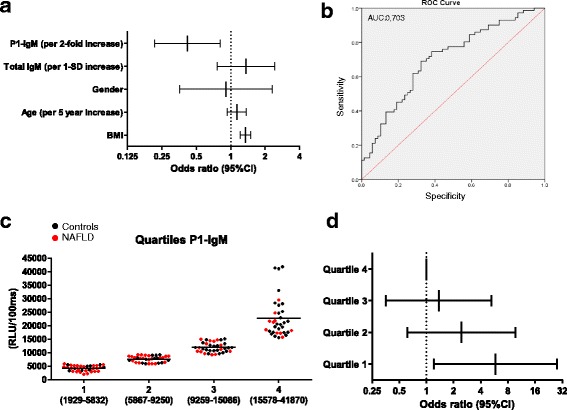
Single logistic regression model, odds ratio determination, and receiver operating characteristic (ROC) curve analysis for P1-specific IgM levels in non-alcoholic fatty liver disease (NAFLD). a Odds ratios for the predictive power of anti-P1 immunoglobulin (IgM) titers (log2 scale) for fatty liver disease after adjustment for age, gender, body mass index (BMI), and total IgM. b ROC curve analysis for the diagnosis of NAFLD with P1-IgM. c IgM titers towards P1 were divided into quartiles (black: controls; red: NAFLD) and d the odds ratios P1-IgM (log2 scale) for NAFLD were computed across these quartiles after adjusting for age, gender, BMI, and total IgM levels. CI confidence interval
