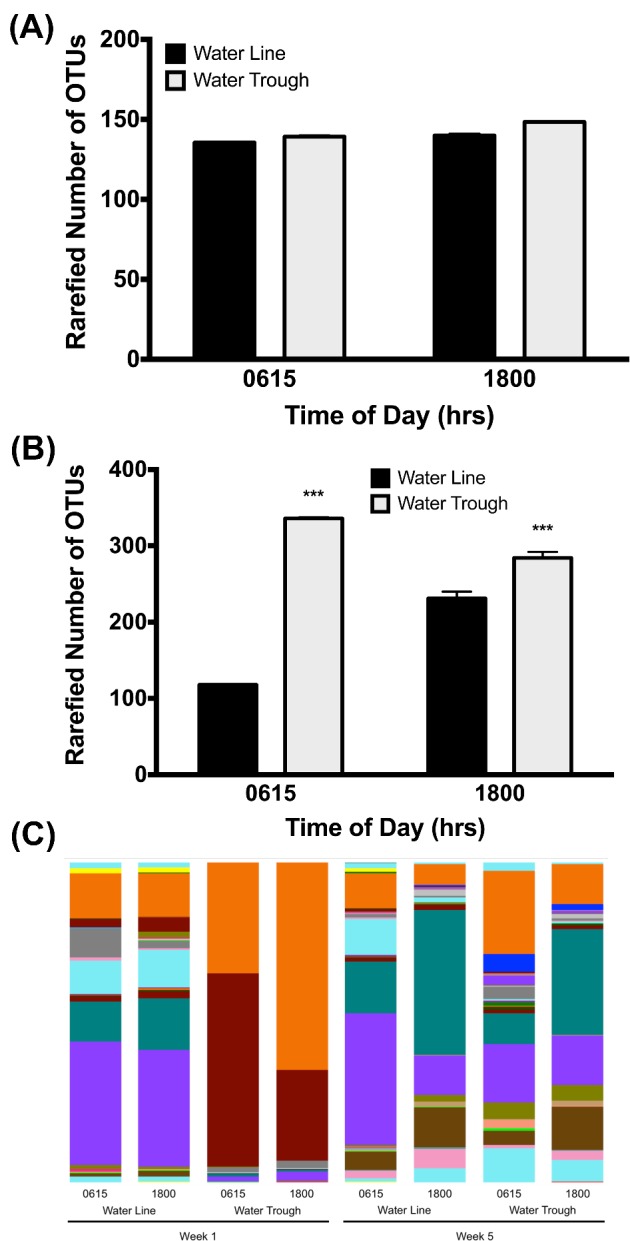
Figure 5.

Bacterial content of water. Microbial community profiling data were used to estimate the number of unique bacterial taxa observed in each sample. The number of observed species at an even sampling depth of 9,700 sequencing reads was used for comparisons in panels A and B. The sampling depth was shown to be sufficient to cover the diversity of the community based on alpha diversity measures as implemented in Qiime 1.8. Statistical significance of differences between number of species observed was determined by two-way ANOVA. (A) An analysis of samples from week 1 of the grow out period showed no significant differences between the number of observed OTU from different water sources or different sampling times after daily cleaning. (B) An analysis of samples from week 5 showed significant differences between the number of observed OTU in water samples with respect to time of day sampled ((F1, 156) = 26.44, P < 0.0001) and water source ((F1, 156) = 509.4, P < 0.0001). Specifically, sampling times late in the day had more observed OTU than sampling within half an hr of cleaning, and water troughs had more observed OTU than water lines. (C) The relative abundance of bacterial taxa for the Order level are shown for water samples from pin-metered lines, troughs, early and late day sampling times, and wk 1 and 5 of the grow out period. Distinct differences in taxa observed and abundances are apparent for the samples at different times of day and in different weeks.
