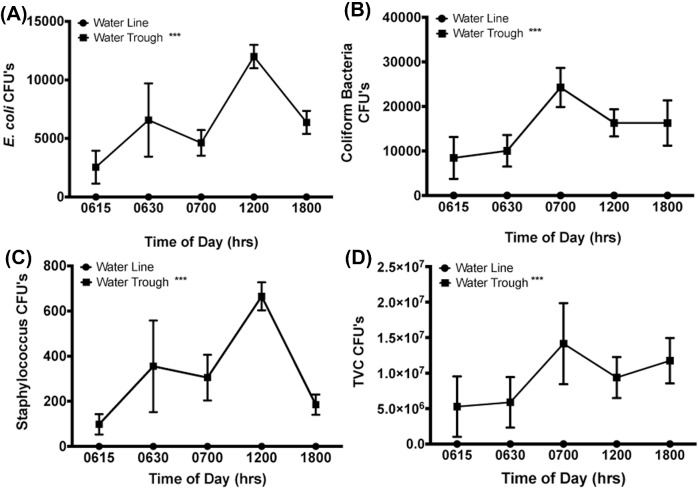
Figure 6.
Analyses of living bacteria in water samples. A representative illustration of the number of colony forming units (CFU) during the last week of the study (day 33) for (A) E. coli, (B) all coliform bacteria, (C) staphylococci, and (D) the total viable bacteria (TVC). At all time points, water samples from troughs showed significantly increased number of culturable bacteria than samples from pin-metered water lines. *** = P < 0.001.

