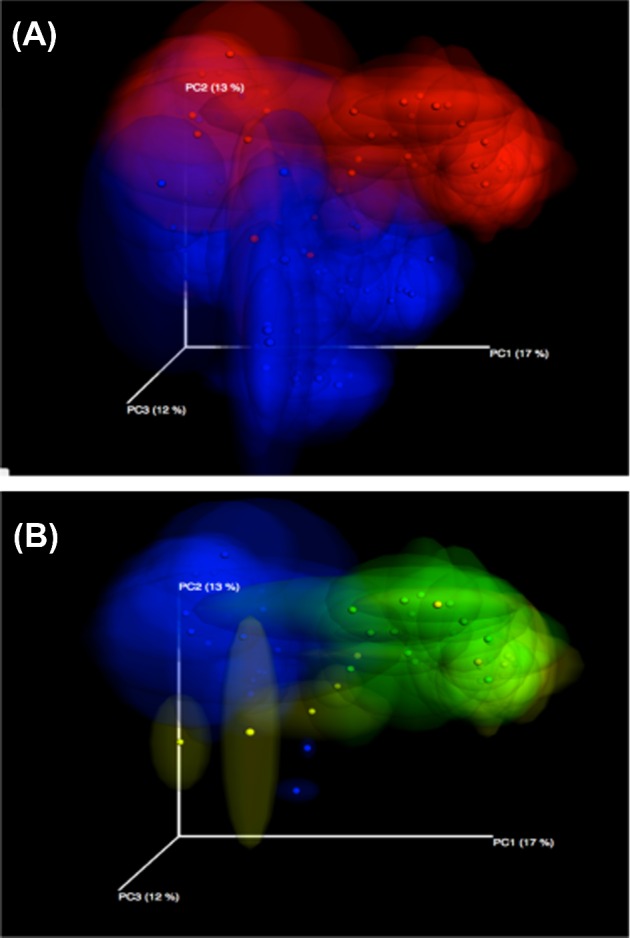
Figure 9.

Microbial community profiling of duck cecal contents and water. Principal coordinate analyses (PCoA) of duck microbial community profiles are shown. Each sample is plotted as a point in multi-dimensional space, where the distance between points is the difference in the bacterial community profiles for each sample. A jackknife statistical resampling approach was used to show the area in which a single point could be plotted, giving a measure of confidence in the location of each point. (A) Samples from duck cecal contents (red) and water (blue) show distinct bacterial community profiles, indicating that the sources of bacteria in the water samples include, but are not limited to, duck fecal matter. (B) Duck cecal samples are colored by age of the duck (day 5, blue; day 23, green; day 33, yellow). There is a clear developmental shift in the bacterial community profiles as the ducks mature during the grow-out period.
