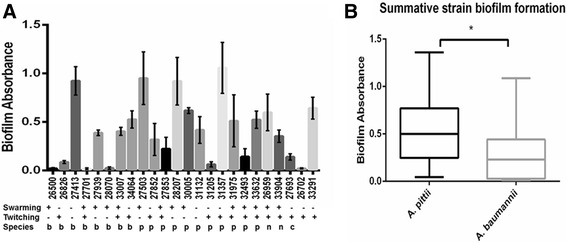
Fig. 2.

Bacterial isolate characteristics. a Individual isolate results of biofilm and twitching and surface-associated motility assays with grouping by species. The level of biofilm formation was determined by measuring the absorbance at 595 nm post crystal violet staining. Error bars represent the standard deviation of the mean of three independent experiments. Twitching and surface-associated motility are characterized as positive or negative based on experimental methods. All experiments performed in triplicate. Strains are designated as: “b” = baumannii, “p” = pittii, “n” = nosocomialis, “c” = calcoaceticus, two strains are undesignated. b Box and whiskers plot demonstrating sum of median biofilm production with minimum and maximum error bars for A. pittii and A. baumannii strains from Fig. 2a, P value =0.018
