
Fig. 2.
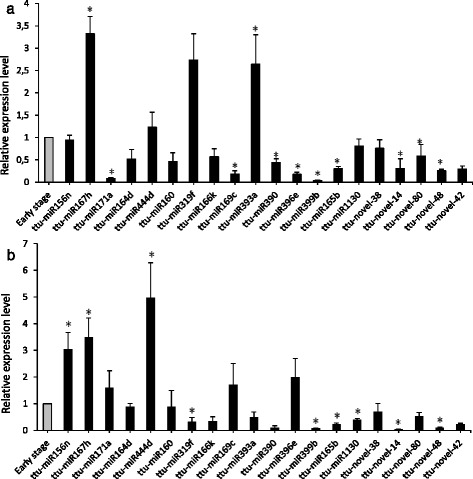
Relative expression analysis of selected miRNAs and target genes. Conserved and novel T. turgidum miRNAs in leaves (a) and roots (b) at the early stage (grey bar, arbitrarily set to 1) and at the mature stage (black bars). Expression levels are given as fold change of mature stage versus early stage. Data are means ± SE. P values between three early stage replicates and three mature stage replicates for each miRNA were calculated using unpaired, 2-tailed student’s t test