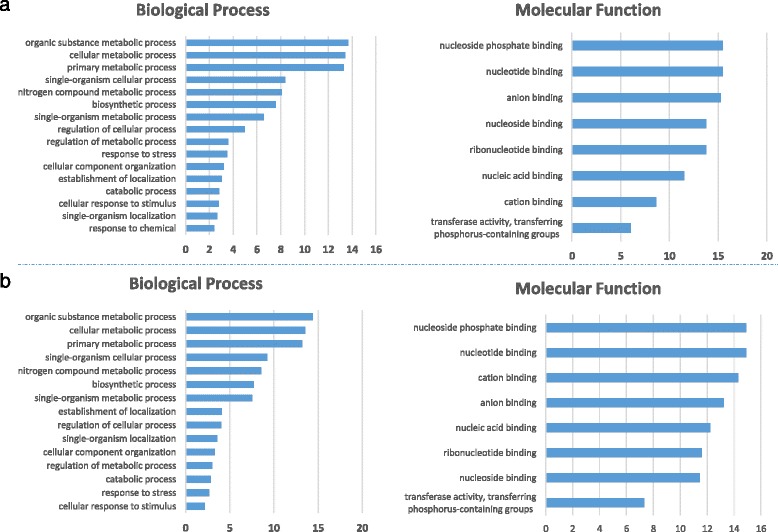
Fig. 3.

Bar charts representing Biological Processes and Molecular function categorization according to GO terms associated to durum wheat miRNA targets; bars represent the percentage of targets enriched for a specific GO term relative to the total number in the category. a GO annotation for conserved miRNA targets; b GO annotation for novel miRNA targets
