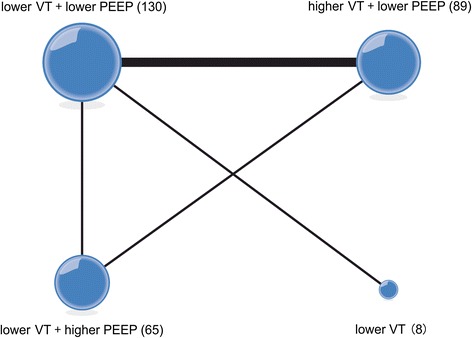
Fig. 2.

Network of the comparisons of the partial pressure of arterial oxygen/fraction of inspired oxygen ratio in the Bayesian network meta-analysis. The size of a given node is proportional to the number of patients (in parentheses) randomized to receive the treatment. The width of each line is proportional to the number of trials (specified next to the line) comparing the connected treatments. PEEP positive end-expiratory pressure, VT tidal volume
