
Fig. 8.
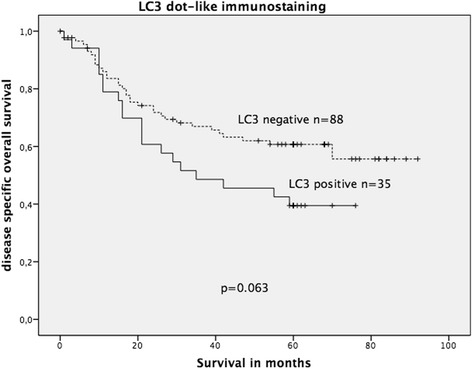
Kaplan-Meier survival plot of 123 colorectal cancers (KRAS wildtype and KRAS mutated) in relation to dot-like LC3 immunostaining intensity. LC3 expression lacked a significant association with OS; however, there was a statistical trend of LC3 expression being associated with decreased OS (log-rank test: p = 0.063)