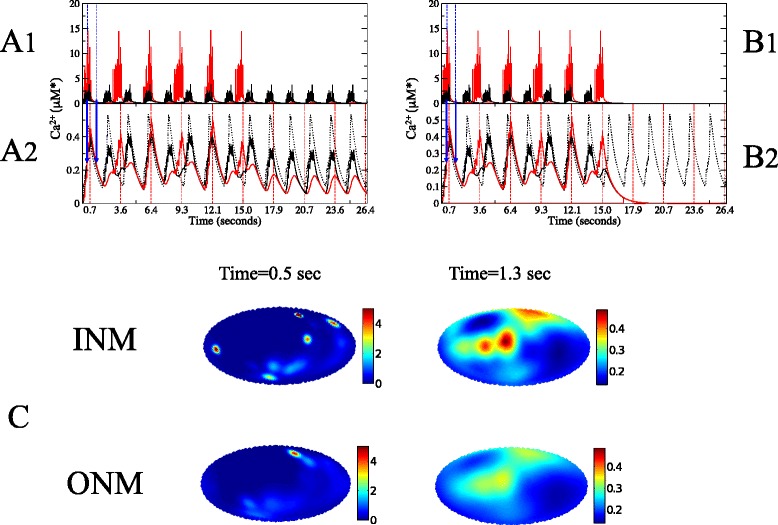
Fig. 4.

The hierarchical scale of the Ca2+ signature, when a porous membrane allows oscillations to be sustained on both sides of the NE. An interior channel fires first. The colours red and black refer to INM and ONM, respectively. The diffusion constant on the inside is D N=5 μm2/s, and on the outside is D C=20 μm2/s. The inner and outer membrane are coupled by 1500 uniformly randomly distributed pores, corresponding to a pore density of 1.9 pores/ μm2. Panels a and b, depict the temporal evolution of the Ca2+ concentration: panels a1 and b1 show the Ca2+ levels surrounding channels, averaged over the 24 channels, while panels a2 and b2 shows levels averaged over 5000 points evenly distributed on the sphere [74]. The x-axis intervals correspond to the refractory period of the INM channels: 2.86 seconds. The dotted oscillating lines represent the average global Ca2+ concentration on an isolated ONM. On the panels a, the INM channels were shut at t=15 s, leaving the ONM channels unaffected. On the panels b, the ONM channels were shut at t=15 s, leading to the interruption of Ca2+ release by the INM channels. The panels c, are an atlas view of the inner surface (top) and the outer surface (bottom) when the inner and outer global oscillations coincide [75], at t=0.5 seconds (left) and t=1.3 seconds (right). These times are signalled by the vertical blue arrows in panels a2 and b2. In these two moments the global concentration is approximately the same and yet the spatial profiles are very different. For presentation, the upper limits of the left atlas are capped at 5 μM*. The upward phase of the cycle (t=0.5 s) occurs when multiple channels are firing, resulting in a heterogeneous spatial profile with clear microdomains, while the downward phase (t=1.3 s) happens after firing events when Ca2+ is diffusing away from the channels. α=0.15, k s=1.0 s −1. The results don’t depend on the side of the initial firing channel. For the meaning of the M* units, see first subsection in Methods
