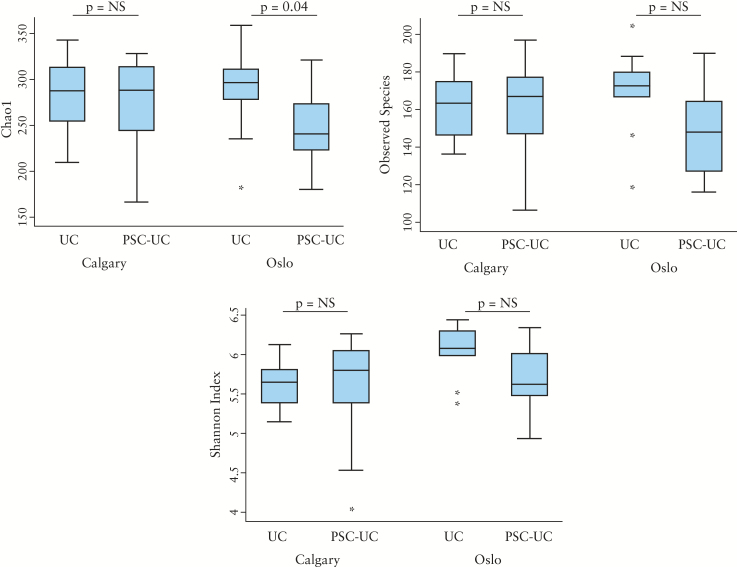
Figure 3.
Comparison of alpha diversity indices between PSC-UC and UC. A, B, and C display alpha diversity expressed as Chao1, observed species, and Shannon index, respectively. Each figure shows Oslo and Calgary cohorts separately and compares alpha diversity in PSC-UC and UC. The Chao1 index was modestly decreased in Oslo PSC-UC compared with UC [p = 0.04]. However, in the Calgary cohort differences in this diversity index between groups did not reach statistical significance. Other measures of alpha diversity [Shannon, observed species] did not differ between phenotypic groups.

