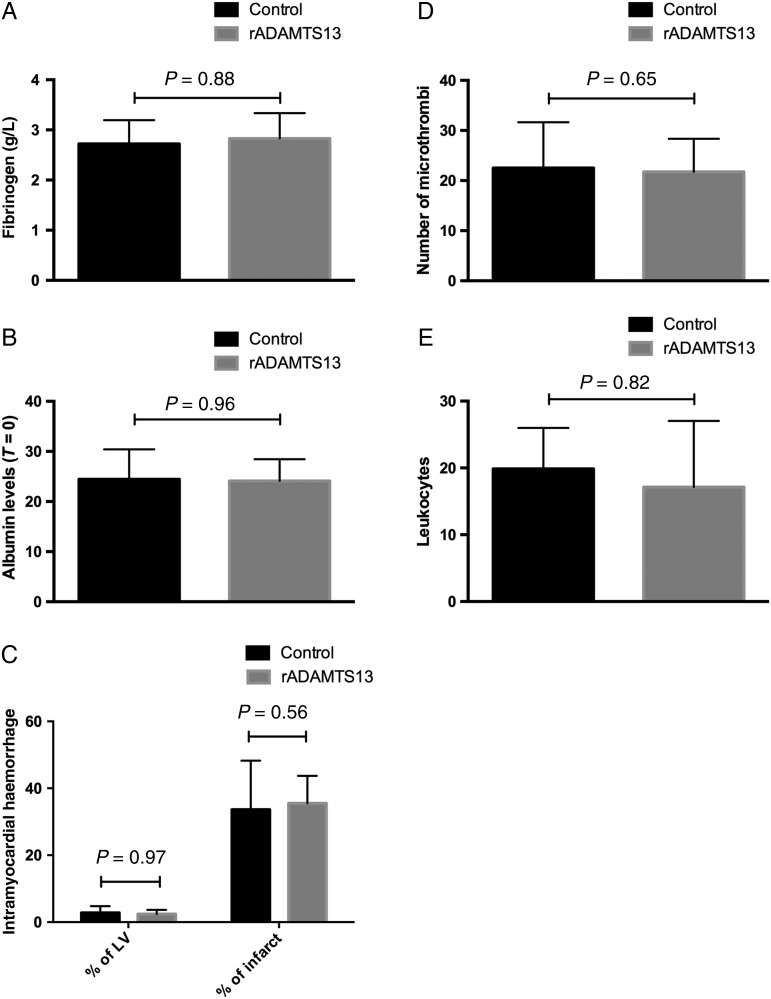
Figure 3.
Fibrinogen and albumin levels, IMH, microthrombi, and leukocytes in the animal model. (A) Fibrinogen levels (T = 75 min), (B) albumin levels (T = 0), (C) IMH in percentage of the LV and as percentage of infarct size (T = 7), (D) number of microthrombi (T = 7), and (E) number of leukocytes (T = 7) in rADAMTS13-treated animals compared with controls. n = 11, 10 (rADAMTS13, control)/group.

