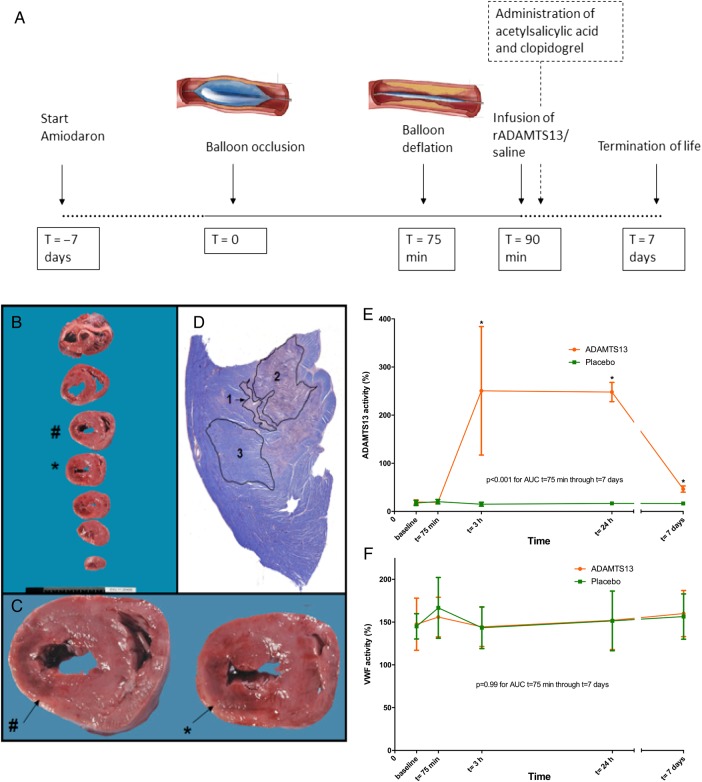
Figure 4.
Study flow chart of the comprehensive study protocol, histopathological methods in the porcine ischaemia-reperfusion model, and ADAMTS13 and VWF activity in the porcine ischaemia-reperfusion model. (A) Study flow chart. (B) Post-mortem sectioning of a porcine heart. (C) Macroscopically visible infarcted area (indicated by # and *) was fixed and embedded. (D) PTAH staining, which stains non-haemorrhagic infarction pink (1), haemorrhagic infarction dark purple (2), and viable tissue blue (3).44 (E) ADAMTS13 activity (%) measured before and after 75 min of balloon occlusion (T = 75 min) of the left circumflex artery (median and IQR). rADAMTS13-treated animals demonstrated elevated ADAMTS13 activity levels compared with controls (P < 0.001). (F) VWF activity (%) measured before and after 75 min of balloon occlusion (T = 75 min) of the left circumflex artery (median and IQR). rADAMTS13-treated animals had similar VWF activity levels compared with controls directly after reperfusion (T = 75 min). P= 0.99 for rADAMTS13. n = 11, 10 (rADAMTS13, control)/group. Mean AUCs were compared using independent samples t-tests.

