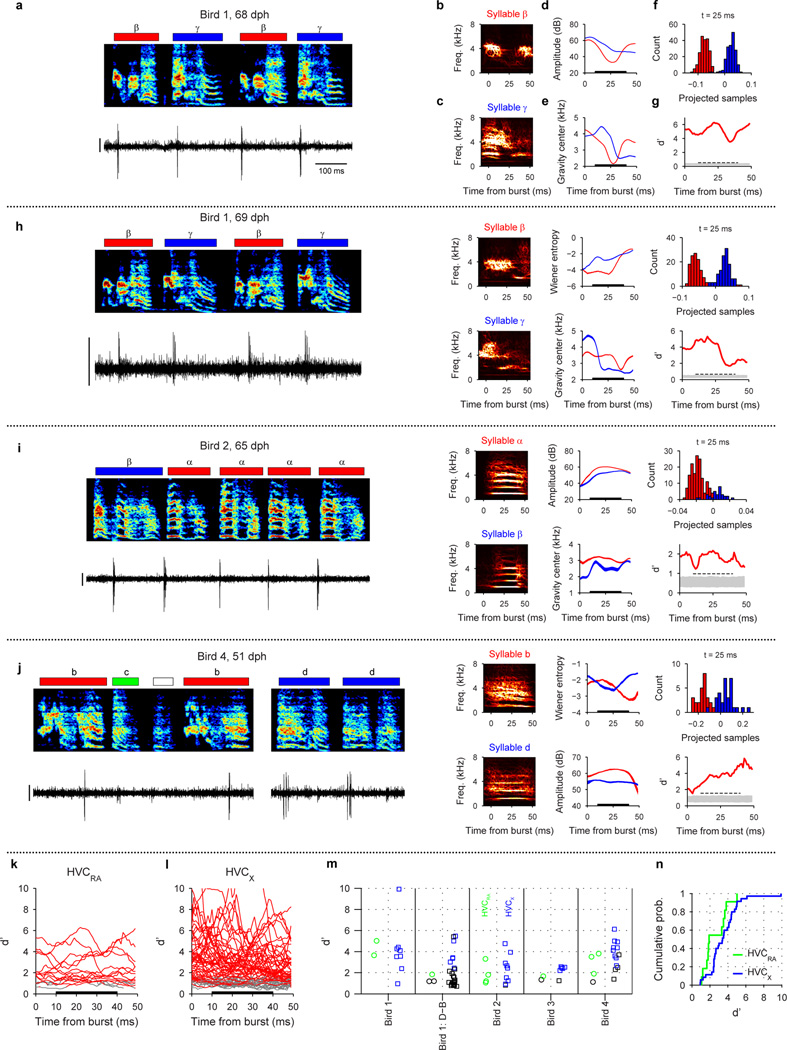
Extended Data Figure 5. Analysis of the acoustic differences associated with shared neuron bursts.
One of the distinguishing features of the emergence of new syllable types is an apparent differentiation of the acoustic structure within the emerging syllables. However, it is possible that shared neurons may only be active at times within emerging syllables at which no acoustic differentiation has yet occurred—that is, at times when the emerging syllable types are acoustically identical. To test this possibility, we analyzed the trajectories of acoustic features of emerging syllable types around the times of shared neuron bursts. a, Shared HVCRA neuron recorded in Bird 1 during alternation between emerging syllable types β and γ (same neuron as Fig. 3e). b–c, Average spectrogram (sparse contour representation; see Methods) computed for syllables β and γ, centered on a 50 ms window immediately after the burst in each syllable. d, Song amplitude as a function of time for syllables β (red) and γ (blue), relative to burst time. Lines show average across all syllable renditions on which the neuron was active. Shading around lines show s.e.m. (for this and several other examples, s.e.m. is too small to be visible). e, Spectral center of gravity as a function of time for syllables β (red) and γ (blue). f, Distribution of projected samples for syllables β (red) and γ (blue), computed by projecting the 8-dimensional vector of spectral features onto a line that yields maximum separability between the two syllables. This distribution is computed at each time (1 ms steps) in the 50 ms analysis window after burst time. Shown is the distribution at t=25 ms. g, d-prime analysis of separability of projected samples for syllables β and γ. The value of d’ is computed as a function of time (1 ms steps; red trace). Also shown is the 95% confidence interval (gray band) computed from surrogate datasets with randomized labels. Dashed horizontal line shows the 95 percentile of the distribution of peak values of d’ in the surrogate data set (identified in the 10–40 ms window). h–j, Acoustic analysis for three additional HVCRA neurons. Panels are analogous to a–g. k, Plot of d’ trajectories for all shared HVCRA neurons. Significant d’ values (above the 95 percentile of peak values) are shown in red. Non-significant values shown as gray line. l, Same as (k) but for shared HVCX neurons. m, Population summary of mean d’ (averaged over the presumptive premotor window 10–40 ms after burst time). Each symbol represents a different shared neuron and each column indicates a different syllable pair. Analysis is shown separately for each neuron type: HVCRA neurons (green circles) and HVCX neurons (blue squares). Neurons with no significant acoustic differences are indicated with black symbols. n, Cumulative distribution of mean d’ for shared HVCRA neurons (green; n=11) and shared HVCX neurons (blue; n=36). Only neurons with significant d’ metric are included in the cumulative. No significant difference was observed between neuron types (P=0.1). Scale bars: (a, h, i, j) 0.5 mV, 100 ms.
Summary of properties of HVCRA and HVCX shared neurons: Shared neurons were found in similar proportion across both HVCRA and HVCX neurons (19% and 28%, respectively; P=0.08; averaged over all developmental stages) and shared neurons of both cell types exhibited the property that bursts have similar latencies during the shared syllables (Extended Data Fig. 4a–d). As shown above, for both neuron types, we observed shared neurons that burst at times where there was a significant acoustic difference between the shared syllables. These findings suggest that both projection neuron types participate in shared neural sequences, and that these shared sequences occur during acoustically distinguishable parts of the emerging syllables.

