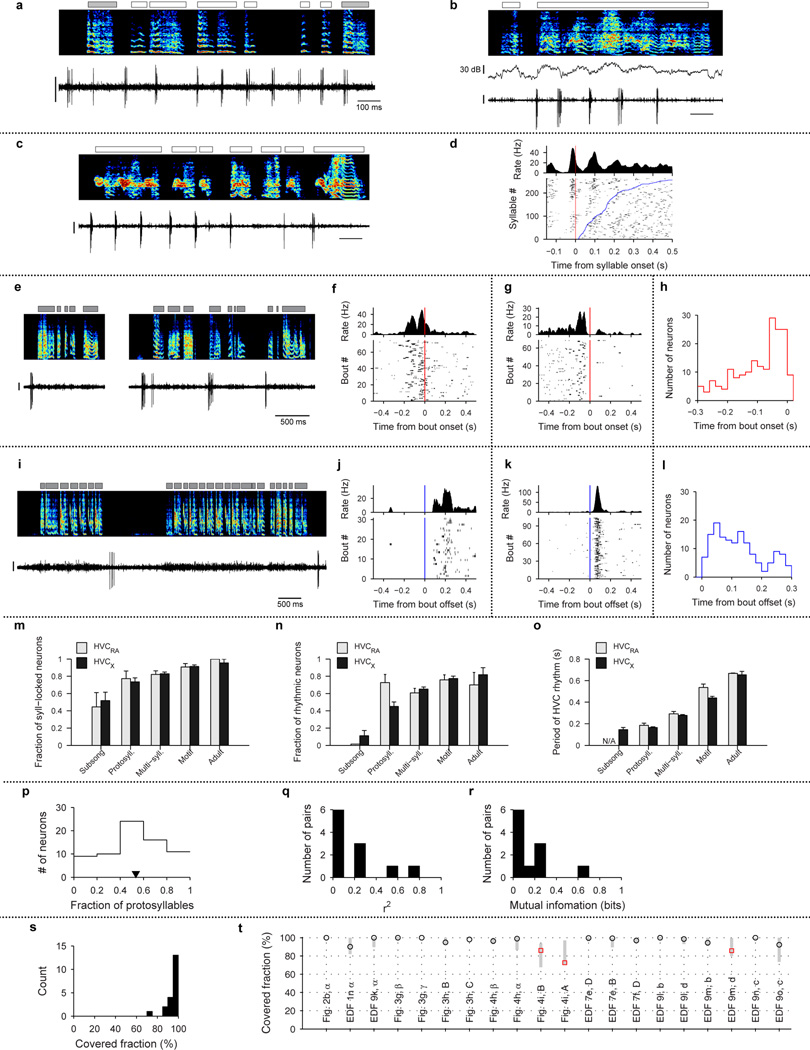
Extended Data Figure 2. Further analysis and examples of HVC projection neuron activity.
a–d, Examples of HVC projection neurons showing rhythmic activity during non-rhythmic song. a, Bird 2, HVCRA neuron, 57dph, b, Bird 12, HVCX, 53 dph, c, Bird 12, HVCRA, 57dph, d, Syllable onset-aligned raster plot for neuron shown in panel c. Syllables are sorted in order of increasing duration (bottom to top; blue line indicates syllable offset). Also shown (top) is onset-aligned spike histogram. Note multiple rhythmic bursts during long syllables. Scale bars: (a–c) 1 mV, 100 ms.
e–l, Bout-related activity of HVC projection neurons. e, Bout-onset neuron (HVCX; 44 dph; Bird 11). f, Bout-onset aligned histogram and raster plot for the neuron shown in (e). g, Bout-onset aligned histogram and raster plot for the neuron shown in Fig. 1d. h, Distribution of pre-bout-onset latencies for all bout-onset neurons (n=187 neurons, 32 birds). i, Bout-offset neuron (HVCX; 61 dph; Bird 1). j, Bout-offset aligned histogram and raster plot for the neuron shown in (i). k, Bout-offset aligned histogram and raster plot for the neuron shown in Fig. 1e. l, Distribution of post-bout-offset latencies for all bout-offset neurons (n=149 neurons, 32 birds). Vertical scale bars: (e, i) 0.5 mV.
m–o, Developmental progression of HVC activity analyzed separately for HVCRA and HVCX neurons. m, Fraction of neurons temporally locked to syllables (mean ± s.e.m.; HVCRA: 9, 22, 84, 54, 10 neurons analyzed at each stage, respectively; HVCX: 27, 91, 376, 244, 22 neurons analyzed at each stage, respectively). n, Fraction of neurons that exhibited rhythmic bursts (HVCRA: 9, 22, 84, 54, 10 neurons, respectively; HVCX: 27, 91, 376, 244, 22 neurons, respectively). o, Mean period of HVC rhythmicity as a function of song stage (HVCRA: 0, 16, 51, 41, 7 neurons, respectively; HVCX: 3, 41, 245, 189, 18 neurons, respectively). Of the 14 comparisons between HVCRA and HVCX shown in m–o, only the period of HVC rhythm (panel o) during the motif stage showed significant difference between the cell types (P<0.05 with Bonferroni correction).
p–r, Analysis of probabilistic participation in rhythmic activity during protosyllables. p, Distribution of fraction of protosyllables on which spiking occurred (n=70 neurons). In contrast to the highly reliable bursting of HVC projection neurons in adult birds19–22, we found that neurons in the protosyllable stage participated probabilistically (mean: 53% of protosyllables; triangle symbol). q, Histogram of the coefficient of determination r2 for protosyllable participation across simultaneously recorded pairs of neurons (median r2=0.072; n=11 pairs; see Methods). r, Histogram of mutual information for protosyllable participation across simultaneously recorded pairs of neurons (median 0.056 bits; n=11 pairs; see Methods).
s–t, Analysis of burst coverage by HVC projection neuron bursts. s, Summary histogram of the covered fraction for all analyzed syllables (n=20 syllables, 4 birds). Note that 17/20 syllables had a covered fraction higher than 90%. t, Covered fraction analyzed for 20 syllables for which raster plots are shown in the main or Extended Data figures. Vertical grey bars indicate 95% confidence interval (2.5–97.5%ile) of coverage expected for random uniform shuffling of the observed bursts (see Methods). Note that for all syllables, the observed coverage is within the confidence interval for randomly shuffled bursts. These findings suggest that, even for the three syllables with coverage less than 90% (indicated with red square symbol), the lower coverage was consistent with undersampling due to the smaller number of recorded neurons in these birds.
Note on two models of HVC coding. Our findings bear on several recent models of song representation in HVC. One earlier model hypothesizes that HVC bursts provide timing signals to drive premotor activity19,58,67 and to control the temporal precision of learning76–79. This model implies a continuous, though not necessarily uniform, coverage of HVC bursts throughout song, as observed in our data. Overall, given the very large number of HVC neurons in each hemisphere80 (>104), our measurements are consistent with a continuous representation of timing signals throughout song syllables.
Another model of HVC coding has emphasized the finding that bursts may occur more often at particular times in the song, related to ‘gestures’ in the vocal control parameters22. Our finding that bursts are more concentrated around syllable onsets early in vocal development suggests that HVC may generate protosyllables as primitive gestures that serve as a scaffold on which later song syllables develop33. During development, HVC activity appears to evolve such that, as a population, bursts occur more uniformly throughout song syllables (Fig. 2c), while the activity of individual neurons becomes sparser and more precise. At the same time, one might imagine that vocal gestures become more complex and precise as syllables develop into their adult forms. In this view, the emergence of sequential activity in HVC may be viewed to drive an increasingly complex sequence of gestures.

