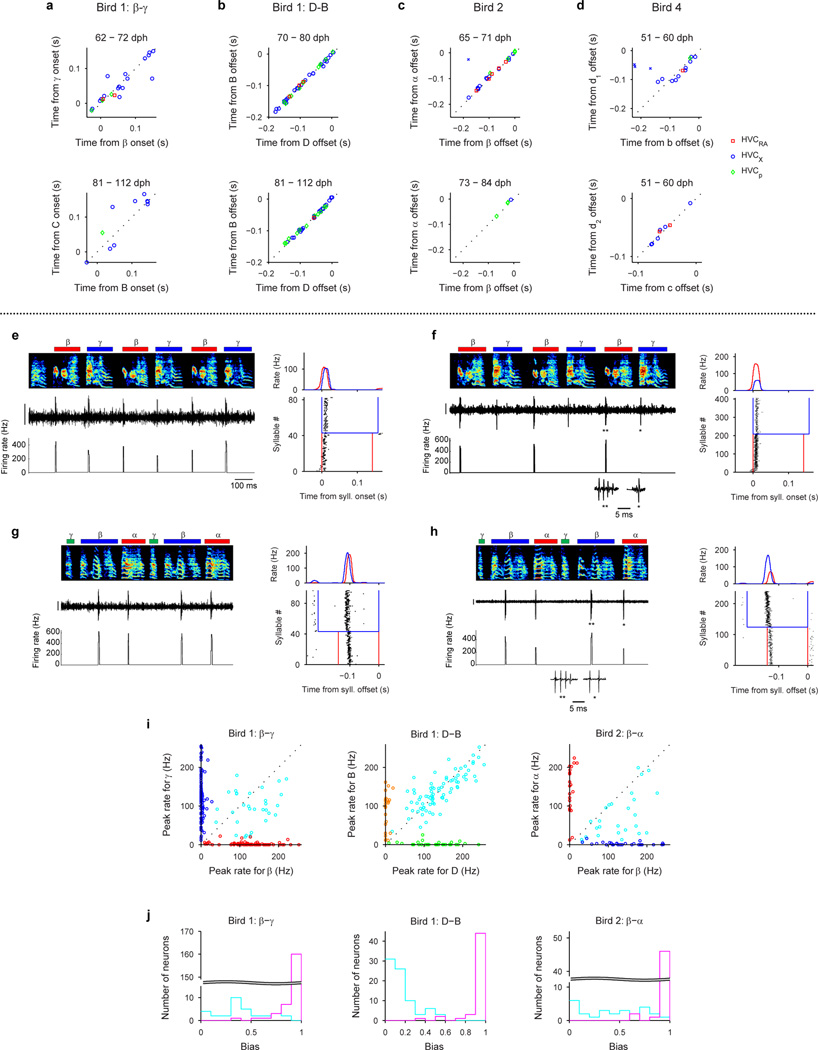
Extended Data Figure 4. Analysis of shared neurons: latency and syllable selectivity.
a–d, Latencies of shared neuron bursts, color-coded by cell type: HVCRA (red square), HVCX (blue circle), and HVCp (green diamond). a, Neurons in Bird 1 shared between syllables β and γ (from Fig. 3) during the early and late stages of syllable differentiation during early (top) and later (bottom) developmental stages. Note strong correlation of burst latencies (early, r=0.91, P<0.001; late, r=0.87, P=0.005). b, Neurons in Bird 1 shared between syllables D and B (Extended Data Fig. 7) during the early and late stages of syllable differentiation (top, early r>0.99, P<0.001; bottom, late r>0.99, P<0.001). c, Neurons in Bird 2 shared between syllables β and α (Fig. 4h) during the early and late stages (top, early r>0.99, P<0.001; bottom, late r>0.99, P<0.001). A shared neuron that had two peaks during the syllable α is shown with an ‘x’ symbol; this point was not included in the calculation of correlation. d, Neurons in Bird 4 shared between syllables ‘b’ and ‘d1’ (Extended Data Fig. 9l) during early stage (top, r=0.89, P<0.001; neurons that burst in the first part of ‘b’ (syllable ‘b1’) are shown with ‘x’ symbol, and were not included in the calculation of correlation). Neurons in Bird 4 shared between syllables ‘c’ and ‘d2’ (Extended Data Fig. 9n) during early stage (bottom, r=0.98, P<0.001).
Bias: As a population, shared neurons exhibited a broad range of selectivity for emerging syllable types—some were equally active for both syllable types while others showed higher activity in one syllable than the other (‘bias’; see Methods). e, Raw spike data (top left) and instantaneous firing rate (bottom left) for a neuron shared between syllables β and γ (HVCp; 68 dph, Bird 1). Also shown is the syllable-onset-aligned raster plot (bottom right) and histogram (top right) showing similar peak firing rates for both syllables (low bias; bias = 0.07). f, Spike data (left) and syllable-onset-aligned raster plot and histogram (right) for a high-bias shared neuron showing higher peak firing rate for syllable β than γ (bias = 0.63; HVCRA; 68 dph, Bird 1). g, Low-bias shared neuron (bias = 0.06; HVCX; 69 dph, Bird 2). h, High-bias shared neuron showing higher peak firing rate for syllable β than α (bias = 0.55; HVCX; 68 dph, Bird 2). i, Scatter plot of the peak firing rates during two different syllable types, quantified by the height of the peak in the syllable-aligned spike histogram. Each dot is a neuron; shared neurons shown in cyan; neurons near the diagonal have low bias. Specific neurons are colored according to the associated syllable and appear near the axes. j, Distribution of the bias for shared neurons (cyan) and specific neurons (magenta). Bias ranged from 0, representing equal activity, to 1, representing activity exclusive to either one of the syllables (see Methods). Specific neurons exhibited a bias tightly clustered around one (0.96 ± 0.011, mean ± s.d.). In contrast, shared neurons exhibited a broad range of bias (0.28 ± 0.22).
These observations suggest that individual shared neurons can exist in a state intermediate between ‘specific’ and ‘shared’—perhaps reflecting a gradual process by which shared neurons become specific. Scale bars: (e–h) 0.5 mV, 100 ms. Inset in (f, h) shows zoom of bursts indicated by asterisk; scale bar: 5 ms.

