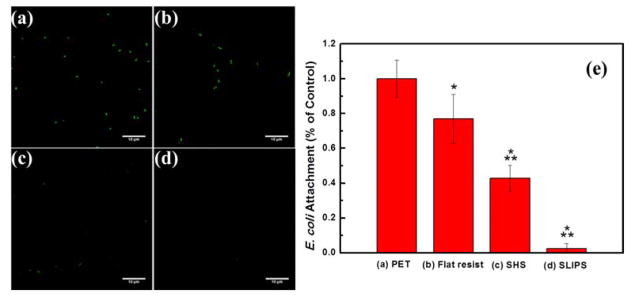
Figure 6.
Fluorescence micrographs of E. coli attached to (a) PET, (b) flat resist, (c) SHS, (d) SLIPS. (e) Normalized E. coli attachment on PET, flat resist, SHS and SLIPS. All values are normalized to the coverage of E. coli on the PET control. Asterisk (*) and (**) denote statistical significance with a p value of (0.01) in reference to PET control and the flat resist, respectively. Scale bar: 10 μm.

