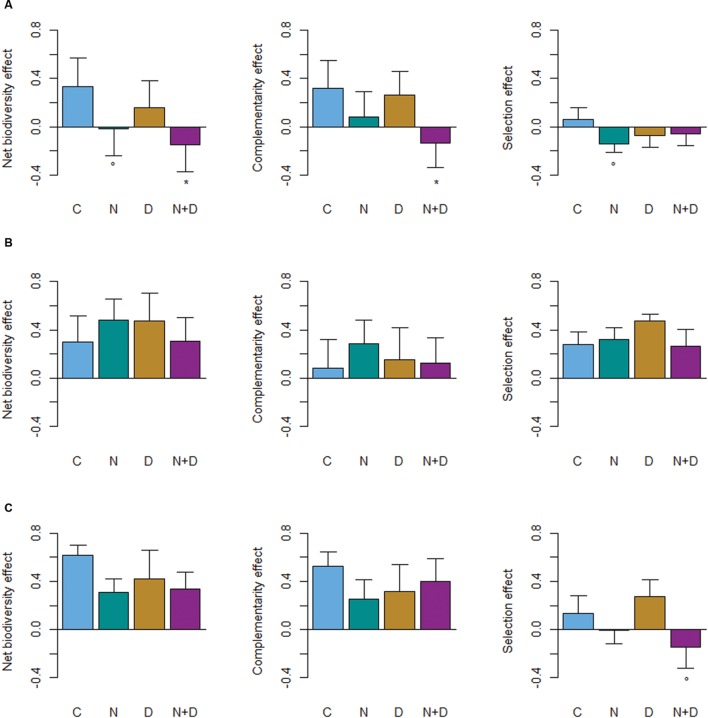
FIGURE 3.
Changes in net biodiversity, complementarity and selection effects with global change drivers (C, control; N, nitrogen addition; D, drought; N+D: nitrogen addition and drought) for (A) beech-oak stands (Fagus sylvatica–Quercus petraea), (B) beech-fir stands (Fagus sylvatica–Pseudotsuga menziesii), and (C) beech-oak- fir stands (Fagus sylvatica–Quercus petraea–Pseudotsuga menziesii). Values are square-root transformed to meet model assumptions while preserving the original positive and negative signs. Asterisks indicate significant differences (P < 0.05) and open circles marginal significant differences (P ≤ 0.1) between the control (C) plots and global change driver (N, D, N+D) treatments.

