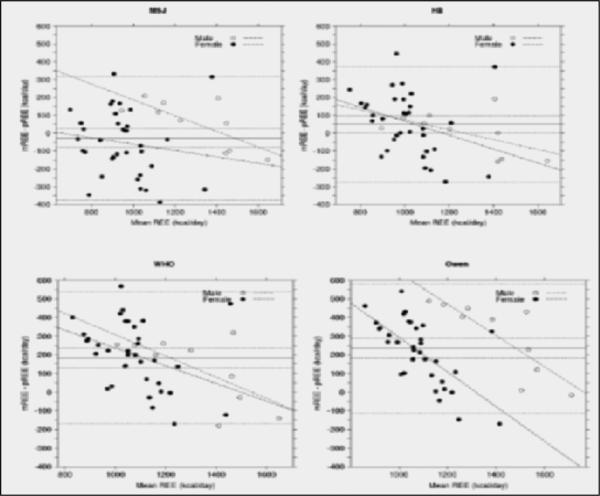
Figure 1. Bland Altman Plots Comparing Predicted to Measured Resting Energy Expenditure.
In each plot, the solid line represents the mean difference between pREE and mREE. The large-dashed lines flanking this solid line represent the 95% confidence interval for the mean difference. The small-dashed lines represent the limits (±1.96 SD) of agreement. Separating males and females allowed detection of systematic bias in a prediction equation.

