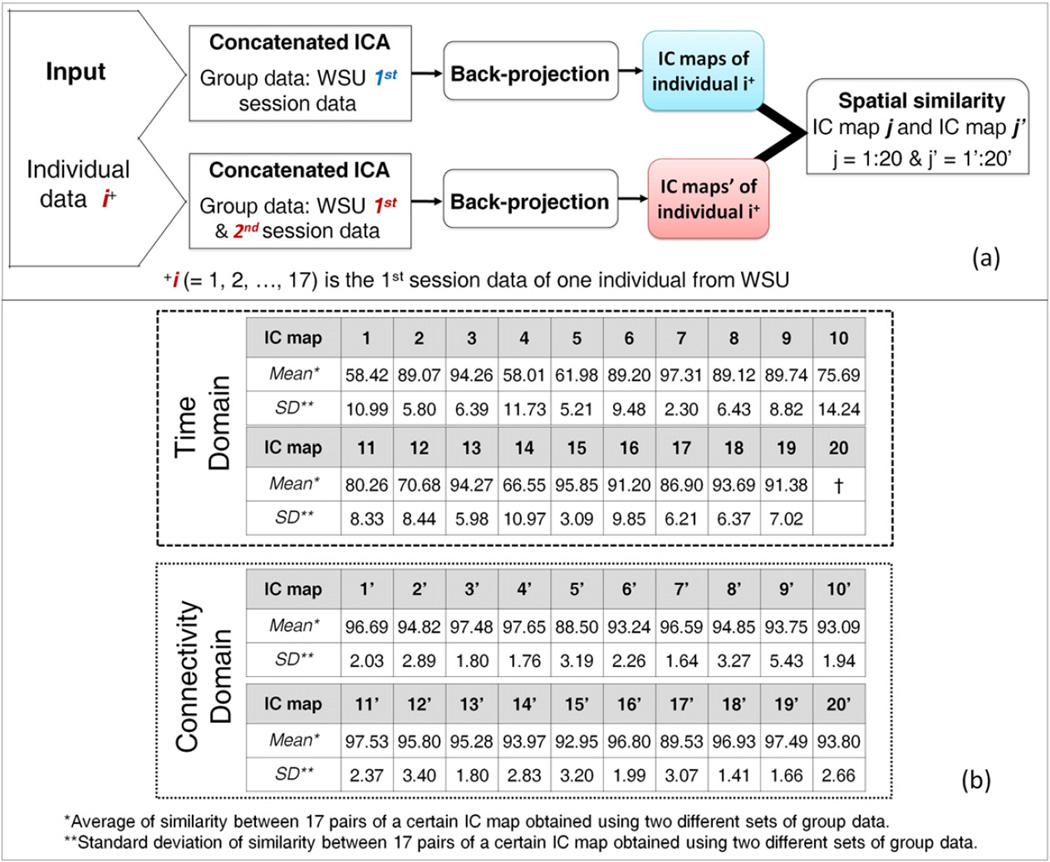
Fig. 7.
Comparison between time domain and connectivity domain analysis in extracting IC maps of individuals' brain when different group data were used. (a) Flowchart of computation of subject-level spatial similarity between the same data analyzed with different group data and the same analytical approach (i.e. concatenated ICA followed by the back-projection), which was performed in both time and connectivity domains. i (= 1, 2, …, 17) is the 1st session data of one individual from WSU. (b) Results of the spatial similarity at the subject level in both the time and connectivity domains. “*” indicates the average of similarity between 17 pairs of a certain IC map obtained using two different sets of group data. “**” indicates the standard deviation of similarity between 17 pairs of a certain IC map obtained using two different sets of group data. † indicates that the corresponding independent component has not been identified in the time domain when different group data was used.

