
Figure 7.
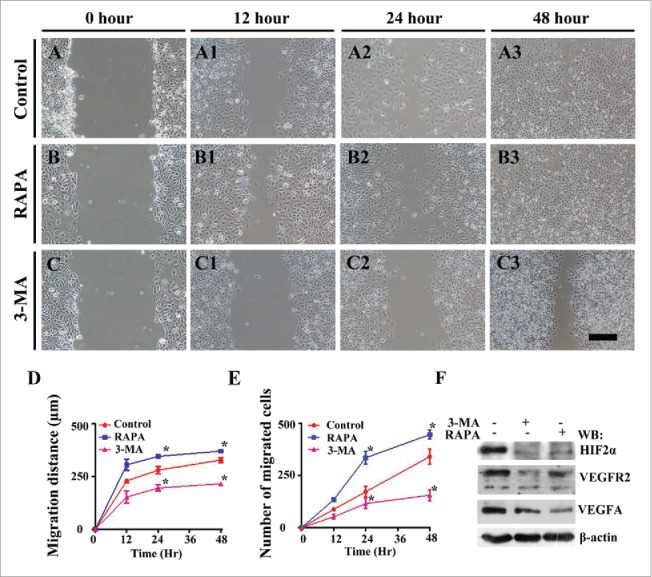
The exposure of 3-MA suppresses, but RAPA does not affect HUVECs cell migration in scratch test. (A-C) The representative images of HUVECs scratch test at 0-hour incubation from control (A), 3-MA-treated (B) and RAPA-treated (C) groups respectively. (A1-C1, A2-C2, A3-C3) The representative images of HUVECs scratch test at 12-h (A1-C1), 24-h (A2-C2) and 48-h (A3-B3) incubation from control (A1-A3), 3-MA-treated (B1-B3) and RAPA-treated (C1-C3) groups respectively. (D) The graph showing the distances of HUVEC cell migration along with incubation time in presence/absence of RAPA or 3-MA. (E) The graph showing the alteration of migrated HUVECs cell numbers along with incubation time in presence/absence of RAPA or 3-MA. (F) Western blot data showing the expressions of HIF 2α, VEGFR2 and VEGFA following the treatments of RAPA and 3-MA. Scale bars = 100 µm in A-C, A1-C1, A2-C2, A3-C3 and 100 µm in A4-C4.