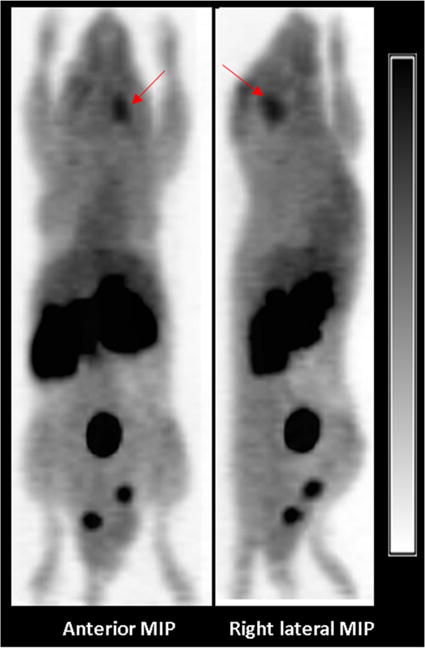
Figure 6.

Representative anterior and right lateral maximum intensity projection (MIP) PET images of obtained 50–60 min after injection of (S)-[18F]15. The intracranial DBT tumor is designated by the red arrow. High levels of activity are seen in the abdomen and pelvis corresponding to the kidneys, pancreas, and the urinary bladder.
