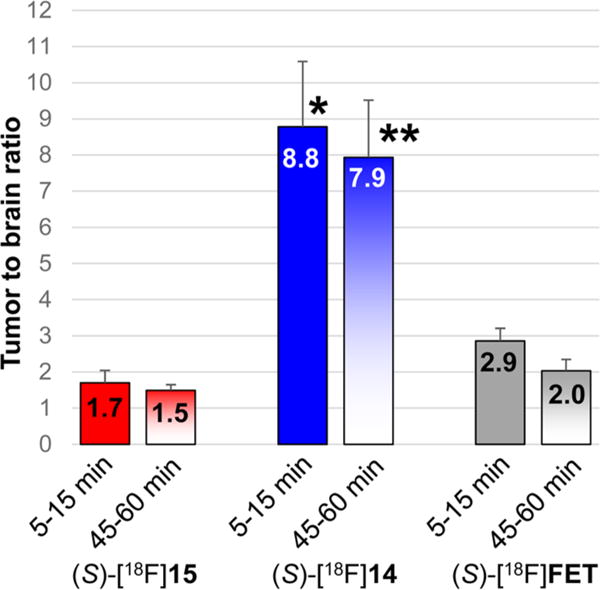
Figure 9.

Tumor to brain ratios from small animal PET studies performed with (S)-[18F]14 in four animals, (S)-[18F]15 in three animals, and (S)-[18F]FET in three mice, at early (5–15 min) and late (45–60 min) time points after injection. Errors bars show standard deviations. p values represent comparisons of the tumor:brain ratios for (S)-[18F]14, (S)-[18F]15, and (S)-[18F]FET through 1-way ANOVA with Tukey post-tests. *, p < 0.001 for 14 vs 15 and vs FET, **, p < 0.001 for 14 vs 15 and FET.
