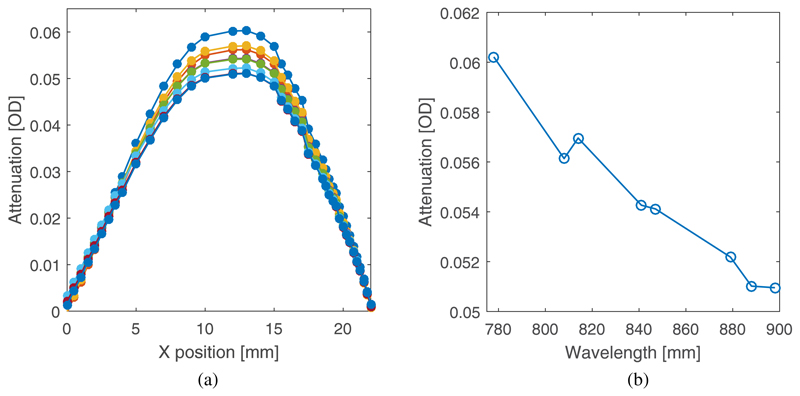
Fig. 8.
(a) The variation in the attenuation of received light for each LED as the high absorbing region of the rod is translated through the midpoint of the cavity in the phantom, below the midpoint of the line joining the source and the detector. (b) The observed maximum change in attenuation due to the high absorbing region as a function of wavelength.

