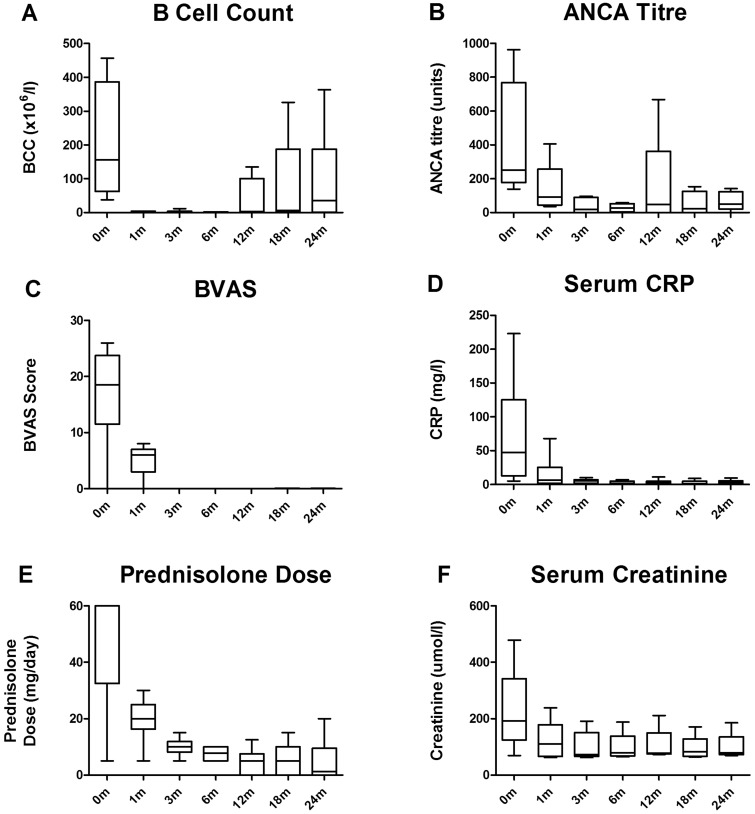
Fig. 1.
Serological and clinical responses at 0, 1, 3, 6, 12, 18 and 24 months following ofatumumab treatment
Box-and-whisker plots describe the median, interquartile range and minimum and maximum values. One patient who presented with dialysis-dependent renal failure and 50% interstitial fibrosis and tubular atrophy on renal biopsy, who did not recover independent renal function, has been excluded from Fig. 1F. Similarly, this case has been censored from all other figures following renal transplantation at 21 months. BCC: B cell count.

