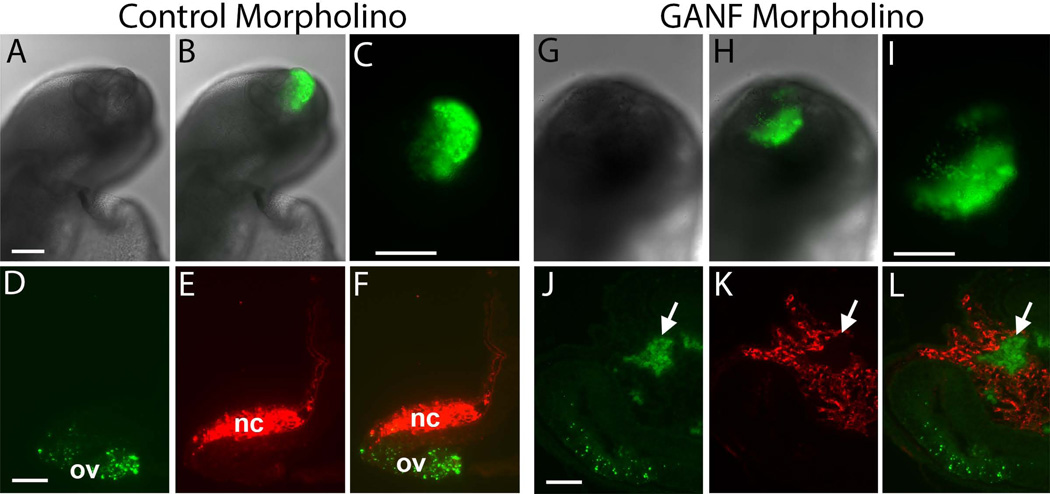
Figure 6.
Morpholino knock-down of GANF results in some cells migrating away from ANF to ANF grafts. (A–F) An unlabeled host embryo two days after receiving an ANF graft that was electroporated with control FITC (green) morpholino. A) Bright field; B) Bright field plus FITC fluorescence; C) High power of FITC fluorescence; D) Section through the olfactory placode showing that FITC+ cells are confined to the placode; E) HNK1 staining of the same section shows that neural crest (NC) cells are present but not FITC+; F) overlap of FITC and HNK1 staining. (G–L) An unlabeled host embryo two days after receiving an ANF graft that was electroporated with GANF FITC (green) morpholino. G) Bright field; H) Bright field plus FITC fluorescence; I) High power of FITC fluorescence; J) Section through the olfactory placode showing that FITC+ cells are present within the placode but that some cells have also moved away into the periphery; E) HNK1 staining of the same section shows that neural crest (NC) cells are present and intermingled with FITC+ cells but the latter are not HNK1 positive; F) overlap of FITC and HNK1 staining. Green = ANF cells; Red = Host neural crest cells.

