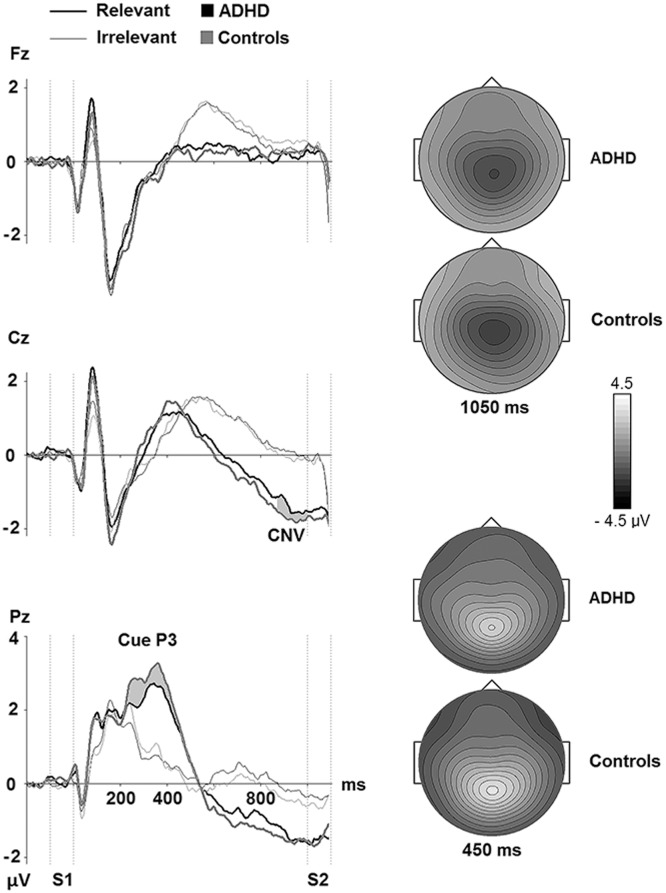
Fig 2. Grand average ERP waves over frontal, central, and parietal electrodes for the ADHD and the healthy control participants in Relevant (Animal = S1) and Irrelevant (Plant = S1) conditions in the cued Go/NoGo task.
The vertical dotted lines indicate the duration of S1 and S2. The grey areas indicate the time intervals that the amplitudes of the Cue P3 (mean of the 300–550 ms interval after onset of S1) and the late CNV (mean of the last 100 ms before onset of S2) were extracted from. They are marked at the electrodes where the components had their maximum amplitudes. Topographic maps of the grand average maximum amplitudes at Cz for late CNV and Pz for Cue P3 are also shown.

