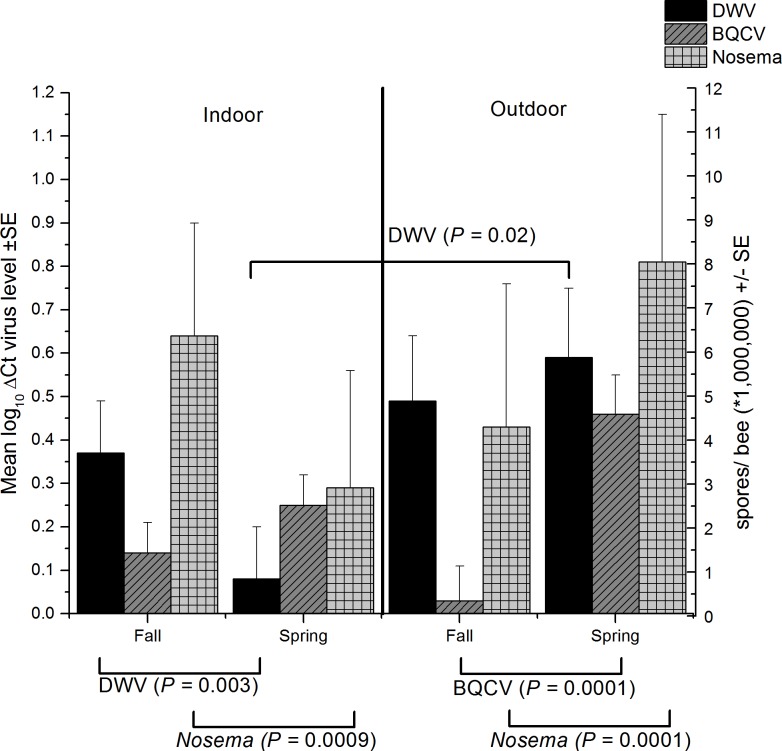
Fig 2.
Interactions between season (spring and fall) and wintering method (indoor and outdoor) (see Table B in S1 File) for DWV and BQCV concentrations (left axis) and mean abundance of Nosema (right axis) (± standard error). Results of significant slices for each virus are indicated above the bars for slices by wintering method and below the graph for slices by season, (horizontal lines indicate significant slices). Data represent pooled values for brood area and entrance samples.

