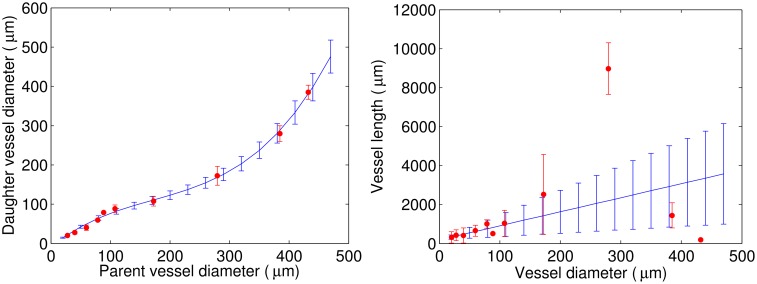
Fig 2. Distributions based on the data published by Nordsletten et al. [15] (red) and their approximations (blue).
Left panel: Daughter vessel diameter as a function of the parent vessel diameter. Right panel: Vessel length as a function of the vessel diameter.

