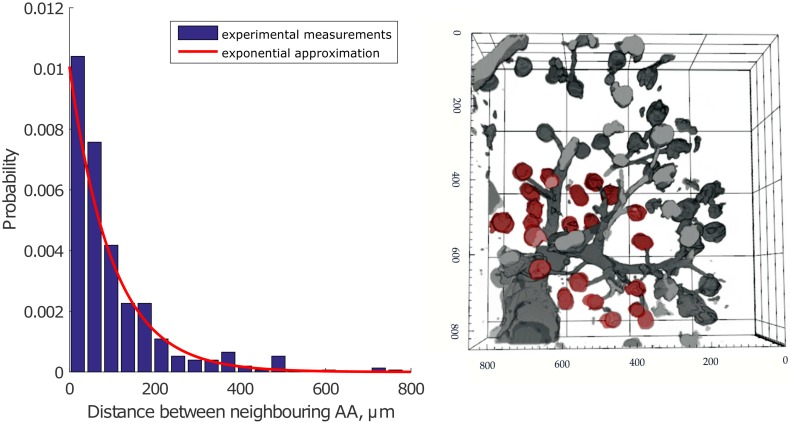
Fig 3.
Left panel: Measurements of the distance between neighboring AAs based on the data from cleared renal tissue (blue) and the exponential approximation (red). Experimental data are normalized to the area under the distribution. Right panel: Reconstructed image shows a stack of renal vessels. Afferent arterioles branch from large vessels that continue their branching (glomeruli are depicted in red color). The dimensions of the stack are 850 x 850 x 211 μm. Axis labels show the original coordinates in μm, but note that the tissue shrinks ≈ 20% in each direction during the optical clearing procedure (see Material and Methods). A correction factor for tissue shrinkage was included into the measurements in the left panel.

