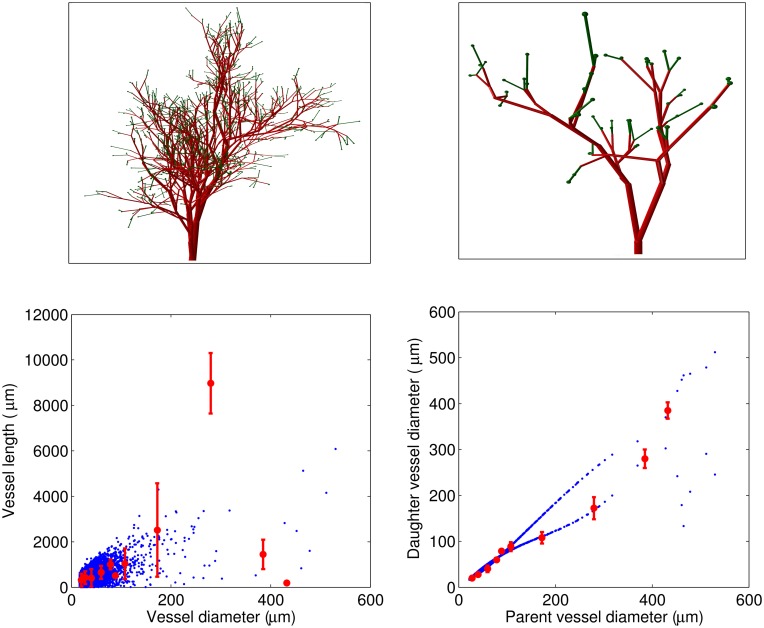
Fig 8. Simulated vascular structure based on the data published by Nordsletten et al [15] with afferent arterioles only at the top of bifurcating tree (ABT).
Top panel: 3D visualizations of the vascular trees with Dstop = 22μm and Dinitial = 200μm and 70μm (left and right panels, respectively). Bottom panel: Vessel length as a function of the vessel diameter (left) and daughter vessel diameter as a function of the parent vessel diameter (right) for simulations (blue) and data described in Ref [15] (red). Note that the difference between simulated and experimental results for the daughter vessel diameter is related to the fact that we use Murray’s law to calculate the diameter of the second daughter vessel.

