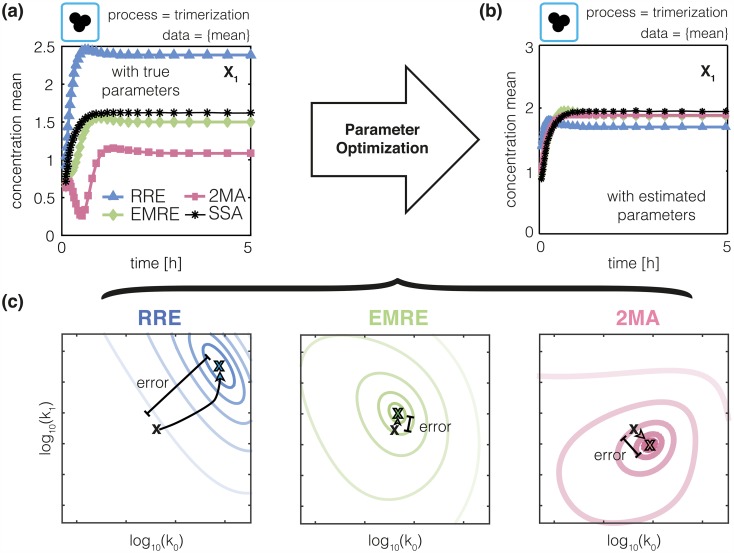
Fig 5. Approximation error introduces estimation error.
(a) Mean monomer concentration in the trimerization process for Ω = 6μm3 computed from 105 SSA trajectory realizations (black line). Approximate mean monomer concentrations obtained using RRE, EMRE and 2MA (colored lines). (b) Mean monomer concentration for RRE, EMRE and 2MA obtained after parameter estimation using the SSA mean as artificial dataset. (c) True (black ×) and optimized parameter values (colored ×) for RRE, EMRE and 2MA. Contour lines of objective function are colored. The opacity increases with increasing likelihood values.

