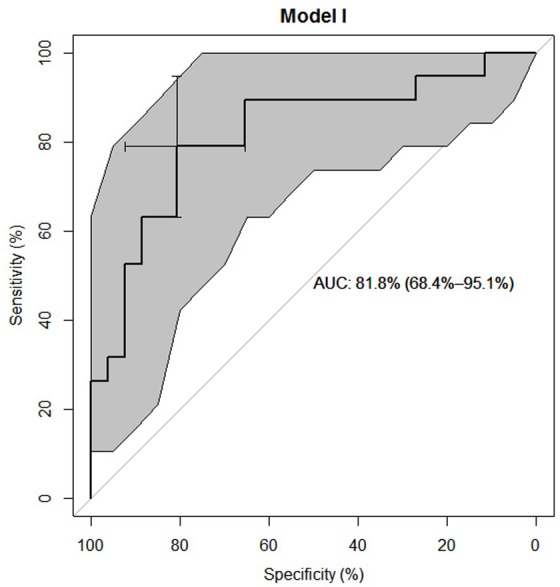
Fig 6. ROC Analysis of Model 1.

Favored predictive model including all variables as predictors shown in Model 1 Table 3A (such as Paralysis: cP = complete Paraplegia, iC = incomplete Paraplegia, cT = complete Tetraplegia, iT = incomplete Tetraplegia; NLI = Neurological Level of Injury; MV = mean IGF-1 serum levels of the first 24 h; A_DB = dichotomized initial AIS = ASIA Impairment Scale, 0 = A, 1 = B-D; AGE = age of the subjects) which enables us to differentiate between neurological remission and no neurological remission in 81.8% [CI: 68.4%–95.1%] of cases. Grey highlighted area represents the particular confidence interval. Confidence interval of the model’s AUC in brackets. Model is based on n = 45 cases.
