Figure 1.
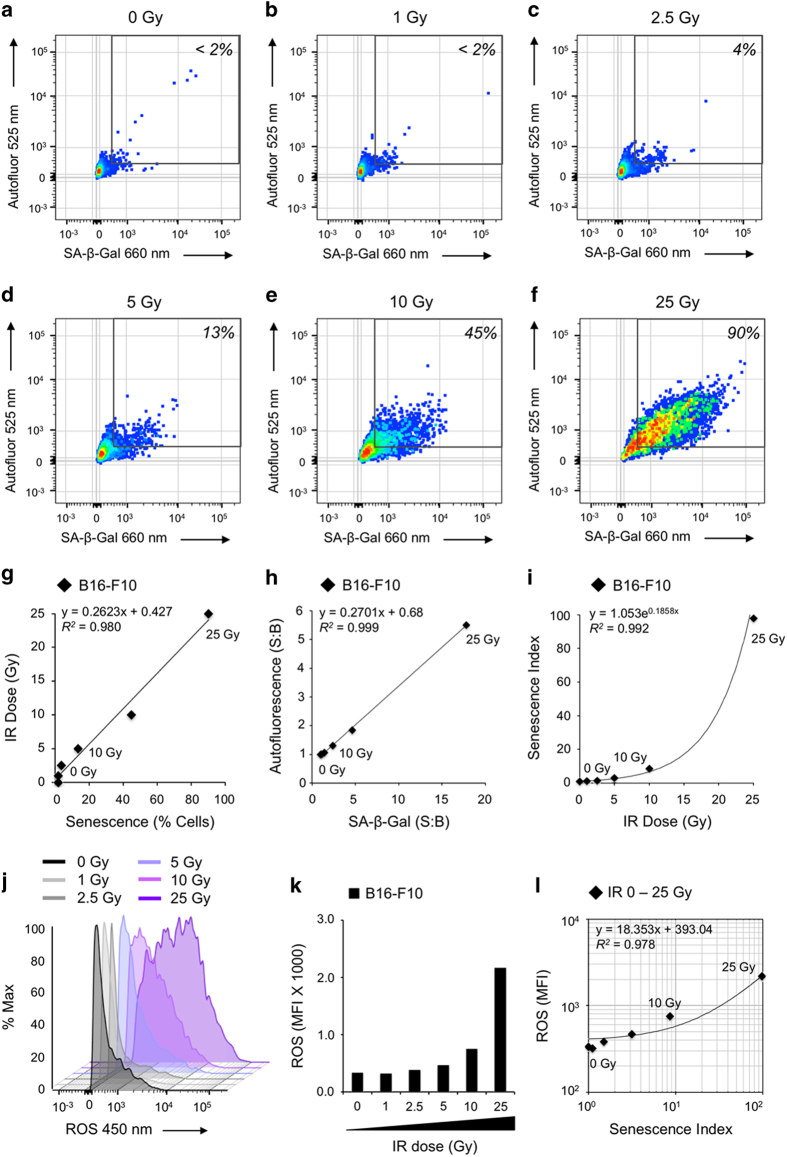
Quantitative measurement of IR-induced senescence and ROS. (a–f) Flow cytometric dot plots indicate increasing senescence with IR dose evaluated by independently measuring SA-β-Gal and AF in each cell. (g) Plotting percent senescent cells of total cell population versus IR dose (0–25 Gy) reveals linear correlation. (h) Linear correlation of SA-β-Gal and AF for cell populations exposed to increasing IR doses (0–25 Gy). (i) Exponentially increasing relationship of IR dose (Gy) versus SI. SI is a novel metric for senescence derived from multiplying the median values for SA-β-Gal and AF. (j) Flow cytometry histograms showing ROS induced by increasing IR dose. (k) Median fluorescence intensity (MFI) of ROS data for increasing IR dose as shown in (j). (l) SI versus ROS (MFI). Data are shown on log/log scale with linear regression plotted (R2=0.98).

