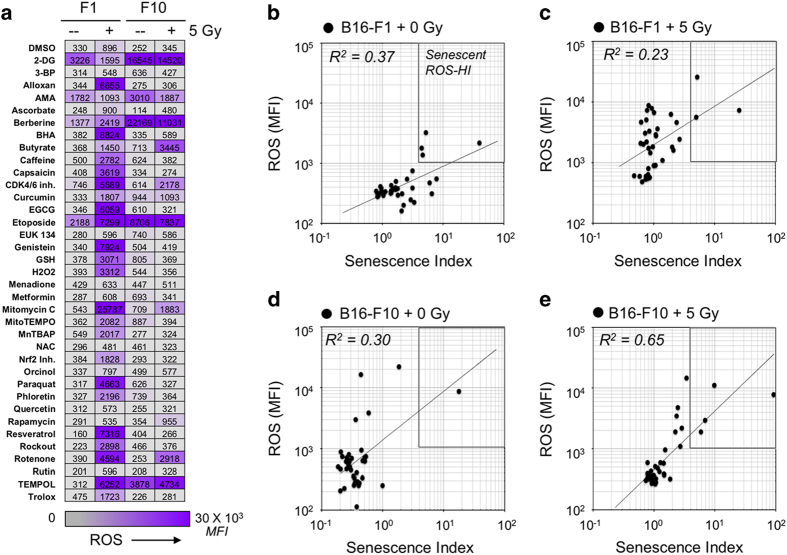
Figure 3.
Flow cytometric ROS screening results. (a) During the senescence screening assay presented in Figure 2, ROS was concurrently measured at 450 nm; data shown were calculated as average median fluorescence intensity (MFI) of duplicate experimental samples. Results demonstrate ROS induction upon IR of F1 cells. This effect occurs in F10, but to a lesser extent. This observation is consistent with radiosensitivity data for the two cell lines, where F1 is radiosensitive and F10 is radioresistant. (b–e) Elevated ROS does not necessarily correlate with AS. ROS data were plotted versus SI for each experimental treatment condition. Only some agents promote both senescence and ROS, whereas many others only elevated ROS, indicating that elevated ROS alone is not sufficient to induce senescence in either of these cell lines.

