Fig. 2.

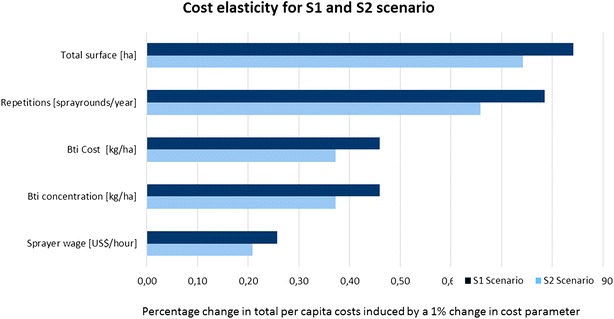
Elasticity of cost factors for the S1 and S2 scenario. The diagram shows the percentage change of costs per person and year protected if the cost factor varies by 1 %

Elasticity of cost factors for the S1 and S2 scenario. The diagram shows the percentage change of costs per person and year protected if the cost factor varies by 1 %