
Fig. 2.
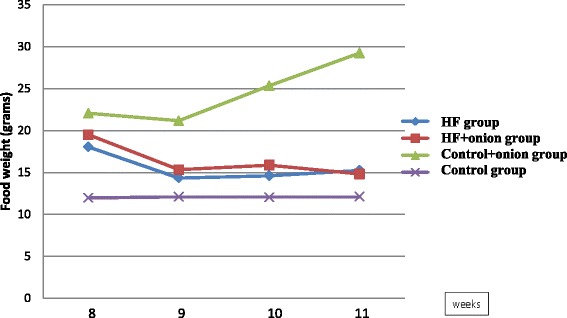
Food intakes in different groups during the study. Food intake was significantly different between four groups in every week (P < 0.01). Food intake was significantly more in control + onion group than other three groups (P < 0.01). Food intake in control group was less than food intake in HF group and HF + onion groups (P < 0.01). No difference was seen between HF and HF + onion group in food intake