Fig. 3.

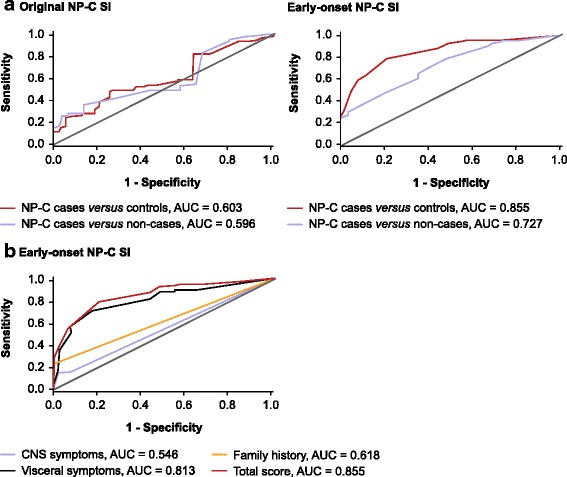
Receiver operator characteristic (ROC) curve analysis. ROC AUC analysis for both the early-onset and original NP-C SI (a) and for symptom categories for the early-onset NP-C SI (b). AUC, area under the curve; SI, suspicion index

Receiver operator characteristic (ROC) curve analysis. ROC AUC analysis for both the early-onset and original NP-C SI (a) and for symptom categories for the early-onset NP-C SI (b). AUC, area under the curve; SI, suspicion index