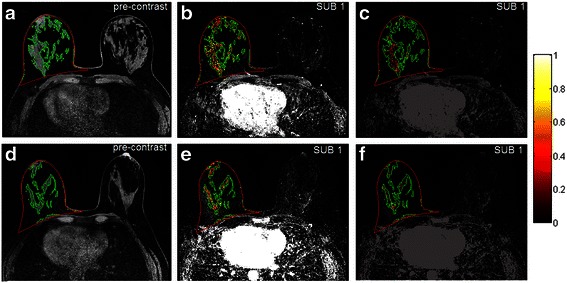
Fig. 3.

Selected representative slices of two magnetic resonance imaging (MRI) scans showing difference in the two kinetic variables between cancer cases and controls. Row 1 is for a 58-year old postmenopausal woman with cancer (mixed invasive ductal carcinoma and ductal carcinoma in situ); row 2 is for a 57-year old postmenopausal woman from the control group, who had a biopsy-proven benign lesion. In all plots, red contours outline the breast area and green contours outline the fibroglandular tissue. Left column (a, d) fibroglandular tissue segmentation. Middle column (b, e) color-coded voxels with a signal enhancement ratio (SER) value > =0.9 (red for washout kinetics having SER >1.3 and yellow for plateau kinetics having 0.9 < =SER < =1.3). These colored voxels on all slices were accumulated to compute SER volume (138.9 cm3 for the cancer case vs 102.0 cm3 for the controls). Right column (c, f) color-coded wash-in slope values. The color bar is for the two rightmost plots (c, f) only, denoting the range of the wash-in slope values. Wash-in slope variance (0.04 for the cancer case vs 0.01 for the control) was computed based on the wash-in slope values of color-coded voxels on all slices. SUB subtraction
