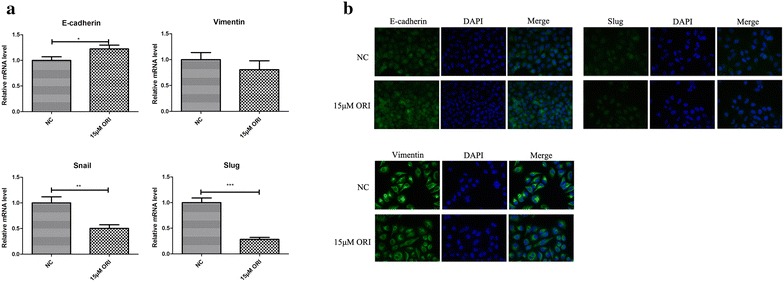
Fig. 2.

Impact of ORI on EMT of tumor cells. a Real-time PCR analysis of EMT markers were compared between control group and ORI group (15 μM). Data are presented as the mean ± SD, n = 3. b Immunofluorescence of EMT markers were compared between control group and ORI group (15 μM). *P < 0.05, **P < 0.01, ***P < 0.001 vs. control group
