
Fig. 2.
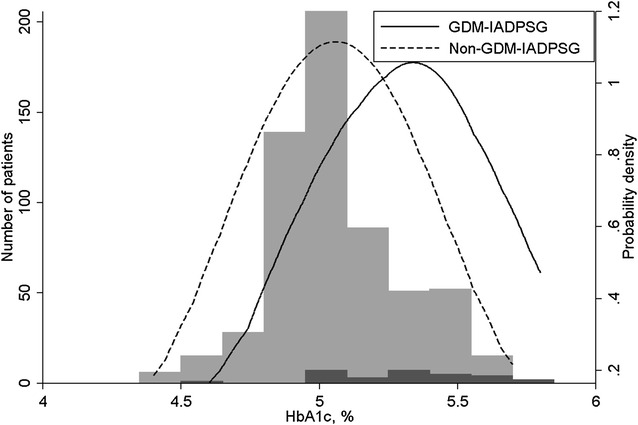
The distribution of HbA1c at pregnancy weeks 32–36 in those diagnosed with gestational diabetes mellitus (black columns) and not (grey columns) at gestational week 32–36 by the modified IADPSG criteria. In addition to the histograms, the figure shows a kernel density plot of HbA1c in each group, where the distributions are smoothed and scaled to the same level of probability density