
Fig. 5.
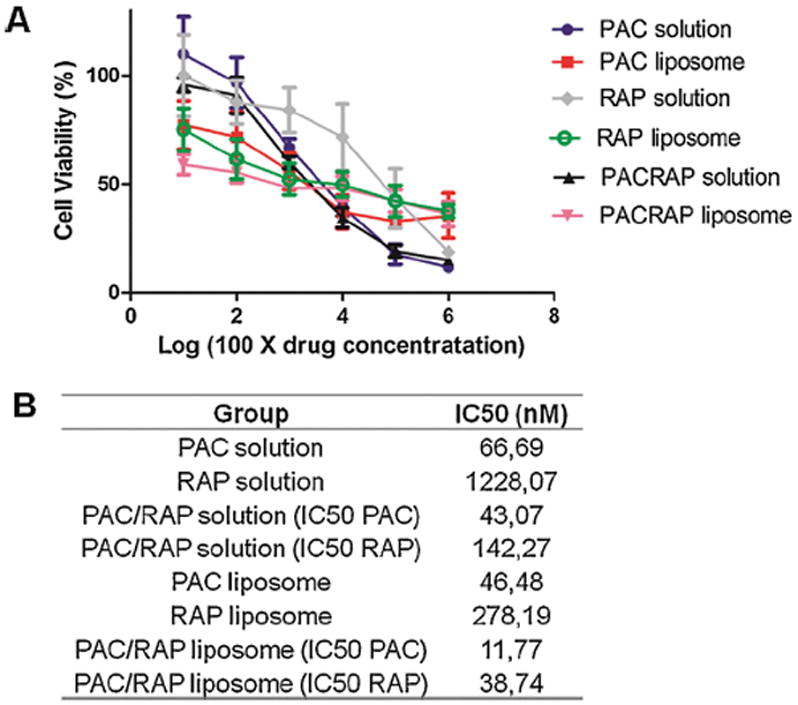
Cytotoxicity evaluation in 4T1 breast cancer cell lines of PAC solution, RAP solution, PAC-loaded liposome, RAP-loaded liposome and PAC/RAP-loaded liposome employing the MTT assay. A represents the dose-response curves and B represents the IC50 calculated for each group.