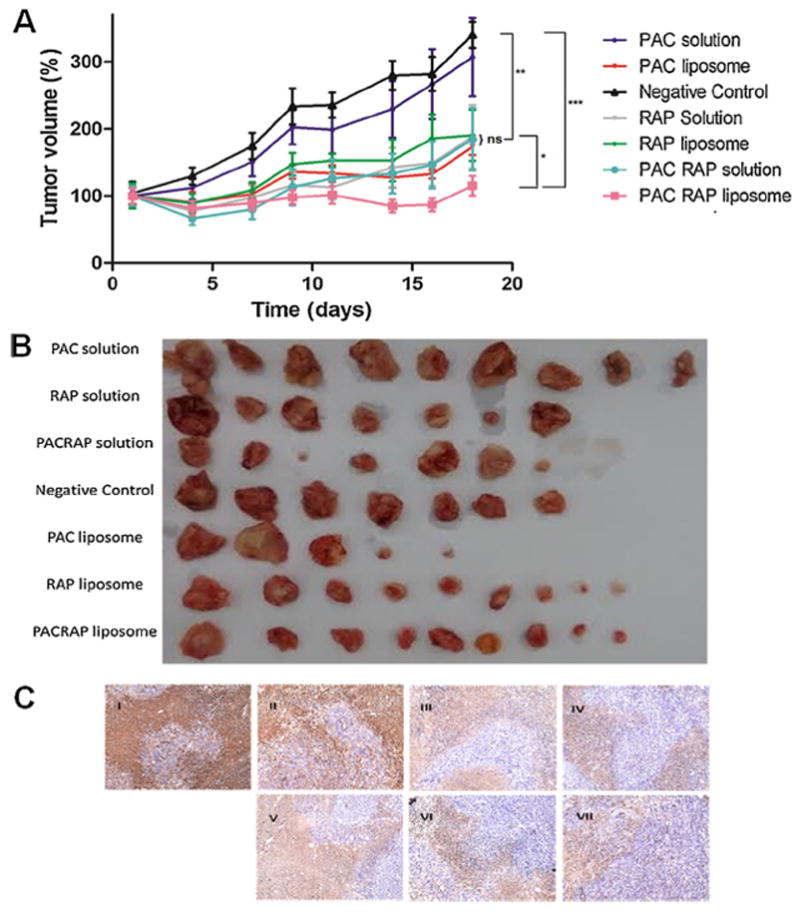
Fig. 6.

Therapeutic evaluation of PAC solution, RAP solution, PAC/RAP solution, PAC-loaded liposome, RAP-loaded liposome and PAC/RAP-loaded liposome in 4T1 tumor-bearing BALB/C mice. A represents the percentage tumor volume increase thought out the study, in which PAC and RAP were administered at theoretical doses of 5 mg/kg and 15 mg/kg twice a week, 5 times in total. B represents the photograph of the tumors after biopsy. C represents anti-Ki67 antibody staining of tumors (I—negative control; II—PAC solution; III—RAP solution; IV—PAC/RAP solution; V—PAC-loaded liposome; VI—RAP-loaded liposome and VII—PAC/RAP-loaded liposome).
