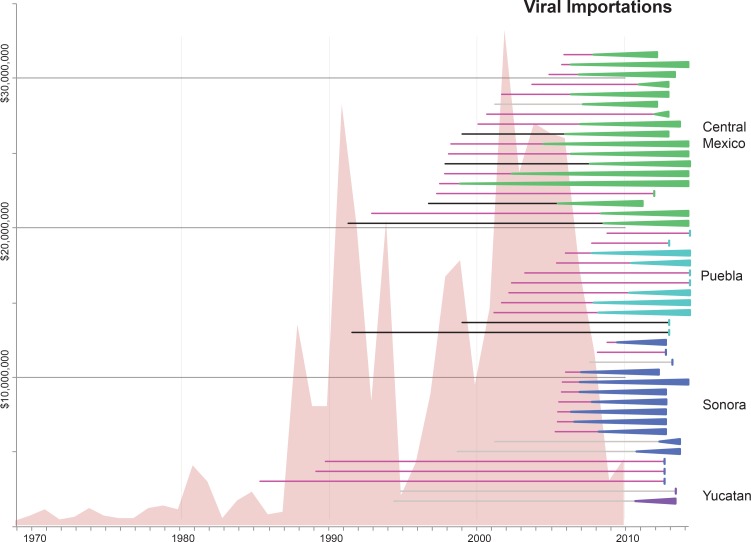
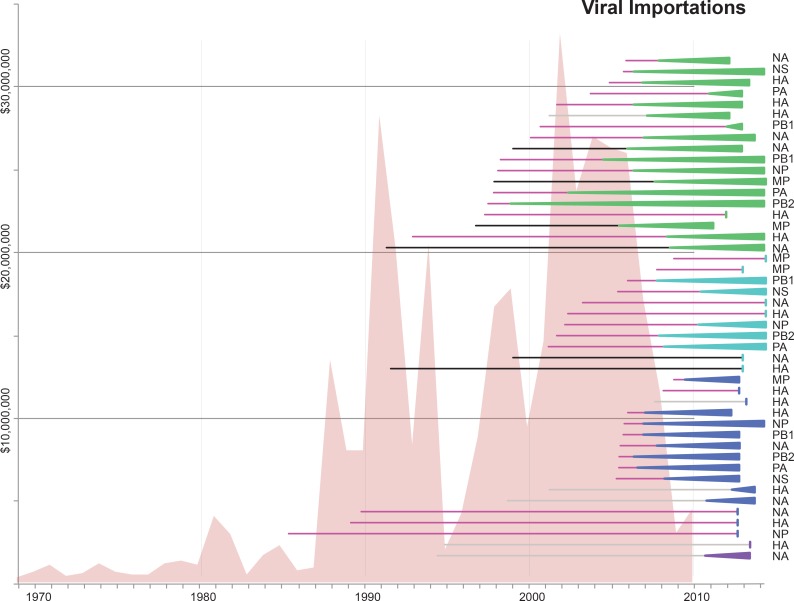
Figure 5. Import of live swine and IAVs into Mexico.
The value of live swine imported into Mexico (USD, y-axis, left) from all countries during 1969–2010 is presented in the background in pink, based on trade data reported to the Food and Agricultural Organization (FAO) of the United Nationals, available in Figure 5—source data 1. Each horizontal line represents an introduction of an IAV segment into Mexican swine, the timing of which is inferred from the MCC trees. The shading of each line indicates the inferred location of origin of an introduction, consistent with Figure 3: dark pink = USA/Canadian swine, black = Eurasian swine, grey = humans. The length of the line indicates uncertainty in the timing of an introduction. Triangles represent clades resulting from onward transmission in Mexico and extend forward as far as the most recently sampled virus. The shading of each triangle indicates the destination location, consistent with Figure 3: dark purple = Yucatan, dark blue = Sonora, light blue = Puebla, and green = Jalisco, Aguascalientes, and Guanajuato (central-west Mexico). Lines without triangles represent singletons. A similar figure annotated with the segment associated with each introduction is provided in Figure 5—figure supplement 1.
DOI: http://dx.doi.org/10.7554/eLife.16777.017


