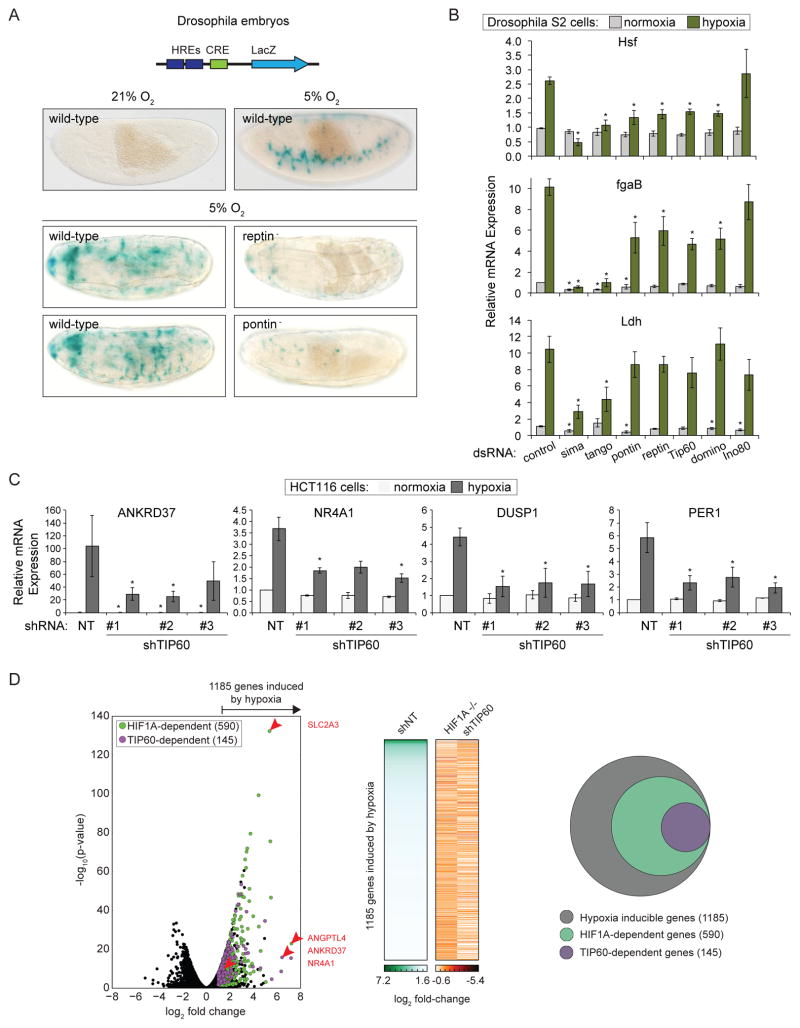
Figure 1. Subunits of the TIP60 complex modulate HIF target gene expression in Drosophila and Human Cells.
(A) Schematic diagram of the murine LDHA enhancer-derived hypoxia-response element (HRE)-LacZ reporter construct inserted into the fly genome. CRE, cAMP Response Element. Wild-type and pontin− or reptin− mutant embryos subjected to normoxia or hypoxia (5% O2 4 hr) were stained with X-gal (blue) to visualize reporter activity. (B) Relative mRNA levels for HIF target genes, as assessed by qRT-PCR, in Drosophila S2 cells treated with the indicated dsRNAs and maintained under normoxia or hypoxia (1% O2 20 hr). Expression values were normalized to Rpl29 RNA and are expressed relative to the control normoxia value. Data are represented as mean ± SEM from at least three independent replicates. Asterisks indicate p-values ≤0.05 by one-way ANOVA. (C) Relative mRNA levels for HIF1 target genes, as assessed by qRT-PCR, for HCT116 cells stably expressing shRNAs targeting TIP60 and subjected to normoxia or hypoxia (1% O2 24 hr). Expression values were normalized to 18S ribosomal RNA (rRNA) and are expressed relative to the control normoxia value. Data are represented as mean ± SEM from at least three independent replicates. Asterisks indicate p-values ≤0.05 by one-way ANOVA. (D) RNA-seq analysis of global mRNA levels in shNT control, HIF1A−/−, and shTIP60 HCT116 cells subjected to hypoxia. Left: Volcano plot of log2 fold change against -log10 p-value for all genes in normoxia versus hypoxia. Green circles, HIF1A-dependent hypoxia-inducible genes; purple circles, HIF1A-dependent genes that are also TIP60-dependent. Selected genes of interest are indicated by red arrows, with labels on right. Middle: Heat map of mRNA log2 fold change values. Right: Venn diagram representing the genes induced by hypoxia (gray), and subsets that require HIF1A (green), or both HIF1A and TIP60 (purple) for hypoxic induction. In all cases hypoxic induction is defined as ratio (shNT normoxia/shNT hypoxia) ≥2, FDR adjusted p-value <10%; and requirement for HIF1A or TIP60 is defined as ratio (HIF1A−/− or shTIP60 hypoxia/shNT hypoxia) ≤0.9, FDR adjusted p-value <10%. See also Figure S1.

