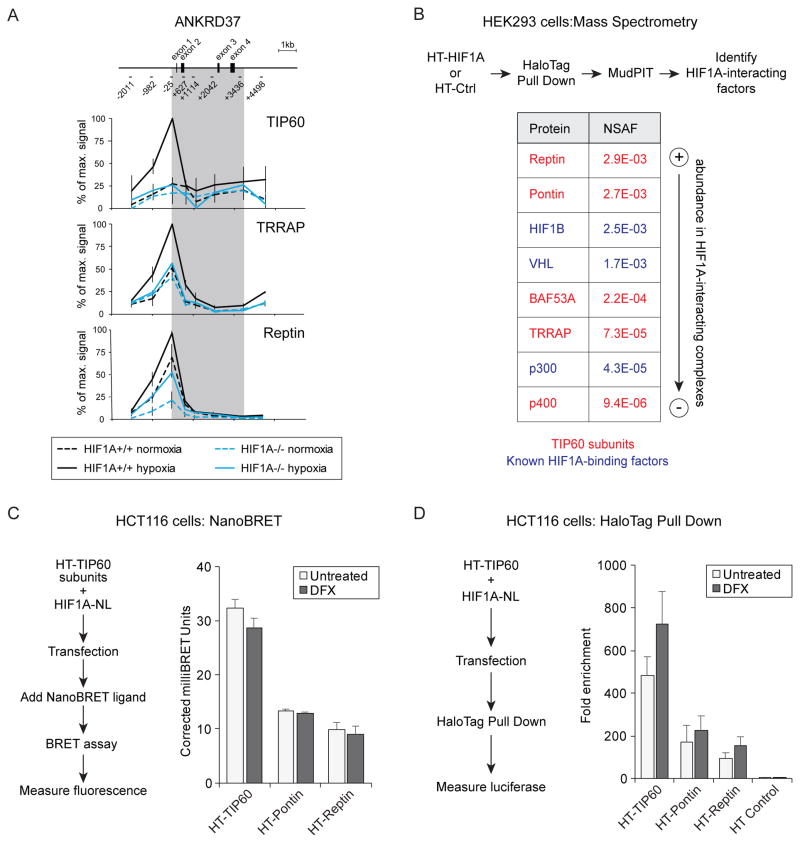
Figure 3. HIF1A directs the TIP60 complex to chromatin.
(A) Quantitative ChIP analysis of TIP60, TRRAP and Reptin at the ANKRD37 locus in wild-type and HIF1A−/− HCT116 cells in normoxia or hypoxia. To represent profiles across the locus, values are plotted as percentage of maximum signal for each epitope. Data are represented as mean ± SEM from three independent replicates. Gray area indicates the transcribed region. (B) Identification of HaloTag (HT)-HIF1A interactors by pulldown and LC-MS/MS analysis. Average normalized spectral abundance factors (NSAF) from two biological replicates are shown for selected proteins isolated in complex with HT-HIF1A from desferrioxamine (DFX)-treated HEK293T cells. Known HIF1A interactors are shown in blue and subunits of the TIP60 complex are shown in red. (C) NanoBRET assays measuring proximity of HIF1A to TIP60, Pontin, and Reptin. HCT116 cells were co-transfected with HIF1A-NL (donor) and either HT-TIP60, HT-Pontin, or HT-Reptin (acceptors). Graph shows corrected milliBRET units for each acceptor fusion protein when combined with the HIF1A-NL donor. Higher values indicate closer proximity. Data are represented as mean + SEM from three independent replicates. None of the comparisons between untreated and DFX values gave p-values <0.05 by T test. (D) HaloTag pull down from HCT116 cells co-expressing HT-TIP60, HT-Pontin, HT-Reptin, or HT control with HIF1A-NL. Pulldown of HIF1A-NL by physical association with HT-TIP60, or HT control, was measured by detection of luciferase activity. Data are represented as mean + SEM from at least three independent replicates. None of the comparisons between untreated and DFX values gave p-values <0.05 by T test. See also Figure S2.

