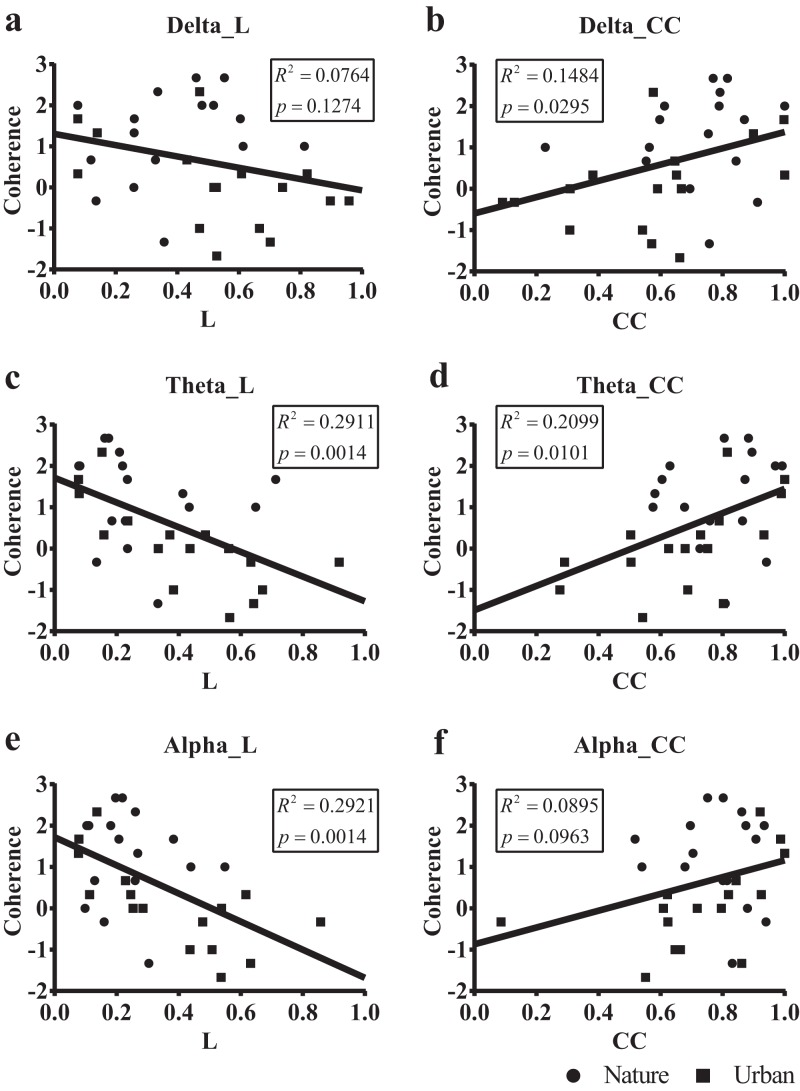
Figure 8. Scatterplots of the PRS coherence scores of 32 participants on their small-world network statistics.
We calculated the individual shortest path length mean (L mean, L) and the individual clustering coefficient mean (Cmean, CC) of the 32 participants by averaging the values at mid-range threshold (from 0.65 to 0.85) at different frequency bands and used the frequency bands as a predictor of PRS coherence in a simple linear regression. The x axis in (A), (C) and (E) denotes the participant’s shortest path length mean (L) averaged by the 14 electrodes, while the x axis in (B), (D) and (F) denotes the clustering coefficient mean (CC) averaged by the 14 electrodes. The y axis in all six figures denotes PRS coherence.

