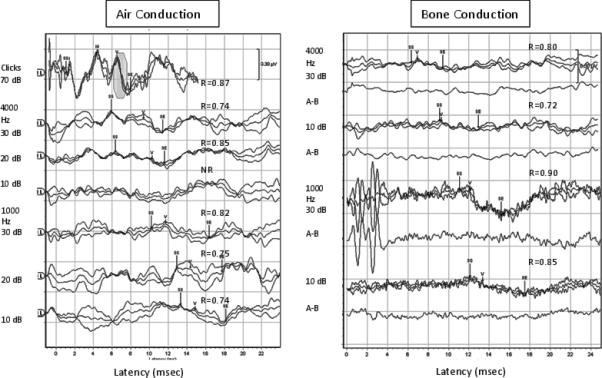
Figure 1.

Typical Click and TB-ABR recording from the left ear of an infant aged 5 weeks for clicks, 4000 and 1000 Hz for AC (left panel) and BC (right panel). Correlation coefficients (R values) are shown above each waveform. Wave V is marked for each set of waveforms (rarefaction, condensation and alternating), along with the region used to calculate the correlations from peak to trough of Wave V, indicated by the Statistical Start (SS) and Statistical End (SE) markers before and after the onset of the Wave V component. Residual noise waveforms (A-B) are also shown below each set of BC recordings.
